
The Asset tab
The Asset tab is the left-hand tab of the side panel. It shows the current selection: one asset in full, or a summary across many assets. Any selection switches the side panel to this tab, whichever tab you were on. Most of the time the tab is already in front of you.
With nothing selected, the tab reads Select or search an asset to view its properties. It also lists the three ways to make a selection. See Selecting and finding assets for those three ways. See The interface for the panel itself and its Toggle side panel shortcut.
One asset
Section titled “One asset”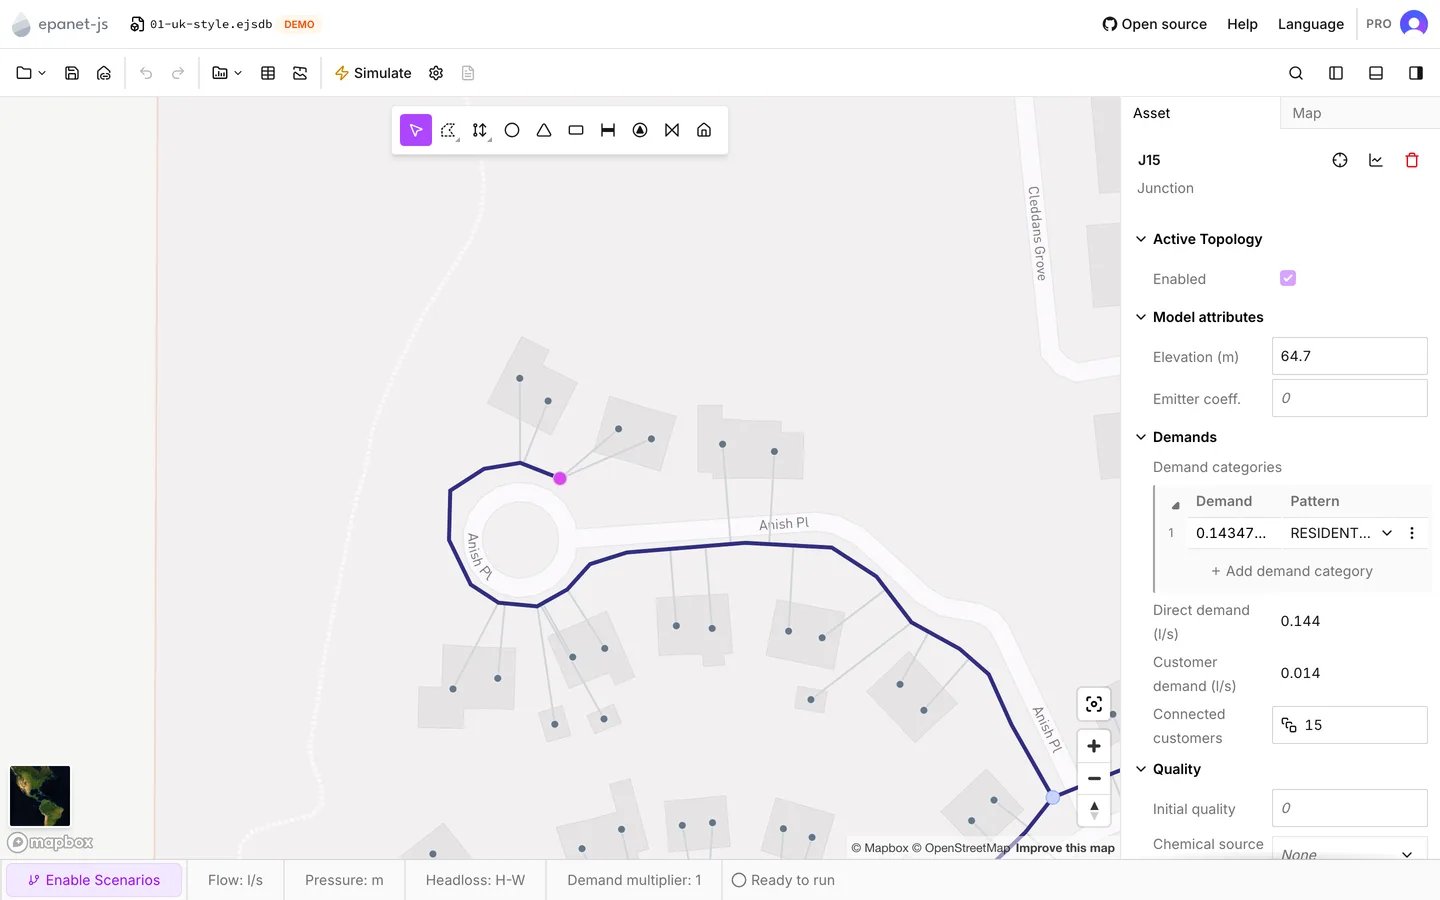
At the top is the label of the asset, which you can edit in place. The asset type is under the label, and a row of actions is beside it:
| Action | On | What it does |
|---|---|---|
| Zoom to | Everything | Zooms the map to the asset |
| Save selection | Everything | Starts a selection set that holds the asset — see Collections |
| Reverse | Pipes, pumps, valves | Swaps the start node and the end node |
| Redraw | Pipes, pumps, valves | You draw a new path for the link |
| Enable / Disable | Pipes, pumps, valves | Takes the link out of the run, or puts it back (active topology, later on this page) |
| View graph | Everything | Shows a graph of the asset over the run |
| Delete | Everything | Deletes the asset |
See Drawing and editing for Reverse and Redraw. See Graphs for View graph.
If the side panel is too narrow for the whole row, some actions do not fit. These actions move into a More actions menu at the end of the row. Save selection is the first action to move. Delete is the last, and View graph moves just before it. The row never gets narrower than three buttons. The multi-asset panel and the panel of a customer point move their actions into the menu the same way.
The sections
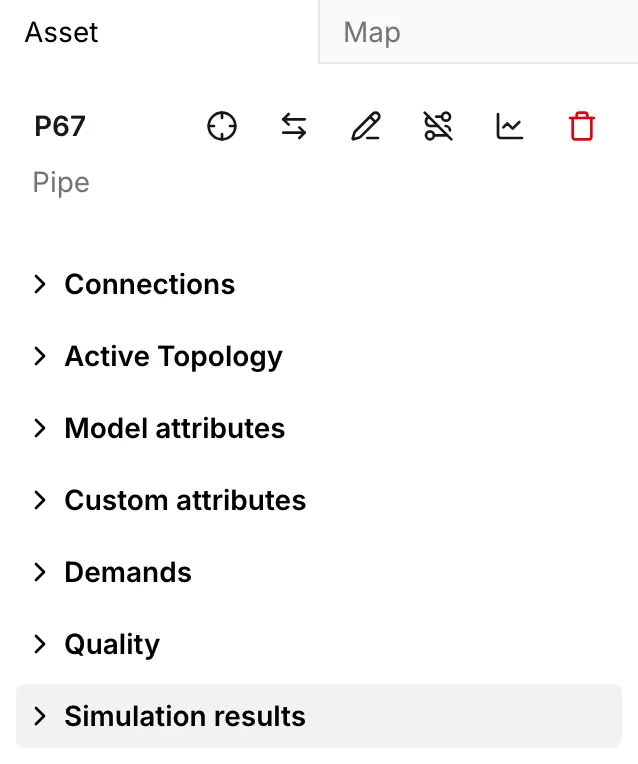
Section titled “The sections”Under the header, the panel groups the properties into collapsible sections. The sections you get depend on the asset type:
| Section | Appears on | Holds |
|---|---|---|
| Connections | Pipes, pumps, valves | Start node and End node, read-only |
| Active Topology | Everything | The Enabled switch |
| Model attributes | Everything | The EPANET properties of that type |
| Custom attributes | Everything, when the project has custom attributes | Your own fields — see Custom attributes |
| Demands | Junctions, and pipes with customers connected | Demand categories and connected customer demand |
| Quality | Junctions, pipes, reservoirs, tanks | Reaction coefficients, initial quality, chemical source |
| Controls | Pumps | Time- and level-based pump control |
| Energy and Energy results | Pumps | Efficiency and price, and the results the run gives for them |
| Simulation results | Everything | The results of the last run |
The page for each asset type gives the meaning of each property. See Junctions, Pipes, Pumps, Valves, Tanks and Reservoirs. For the EPANET concept behind a property, the reference is the EPANET 2.2 manual.
Every section starts expanded, except Energy and Energy results. If you collapse a section, it stays collapsed for every asset you select afterwards, and also after a reload. This state belongs to the browser, not to the project.
Editing
Section titled “Editing”The app commits a change to a field when you leave the field or press Enter. Esc puts back the old value. Every edit is one undo step.
The app refuses a value that is not a number, and the field goes back to the old value. The model can consider a number out of range, for example a negative diameter. The app marks that number with a warning, but it still commits the value. As a result, a half-entered model stays as you left it, and the pre-run check is what stops you. See Running a simulation.
The app computes some fields, and you cannot type into them: Start node and End node, Direct demand, Connected customers, and everything under Simulation results.
Results before a run
Section titled “Results before a run”Simulation results is always there. Before a run, its rows read Not available. After a run, the rows carry the values for the timestep that the time browser shows.
The water quality rows are Water age, Water trace and Chemical. These rows appear only when the run produced them, so the section is shorter until you turn on the water quality analysis. See Reading results and Water quality.
Links carry both Initial status and Status. You set Initial status. Status is what the engine did with it, for example a check valve that shut, or a PRV that went active.
Labels
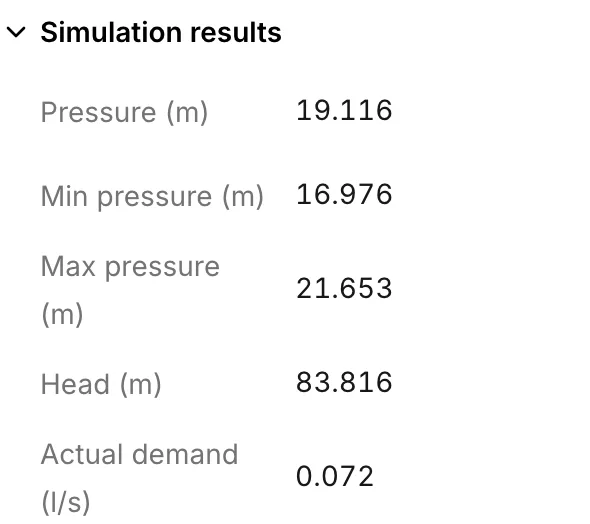
Section titled “Labels”The field at the top of the panel is the label of the asset. The map, the data tables and the search box all show this label. The label becomes the EPANET ID when you export an INP. The export shortens the label to what the naming rules of EPANET allow, and the app allows more than those rules. See Import and export.
- New assets get a label from their type as you draw them:
J1for junctions,P1for pipes,PU1for pumps,V1for valves,R1for reservoirs,T1for tanks,CP1for customer points. When you import an INP, the assets keep the IDs the file already had. The app trims an ID that is longer than 64 characters. - Labels must be unique among nodes, and separately unique among links. A
junction and a pipe can both be
1, but two junctions cannot. The comparison ignores case, soJ1andj1collide. The app refuses a duplicate with Label already in use, and the old label stays. - The app deletes spaces and semicolons as you type, because the format of EPANET cannot carry them. A label has a limit of 64 characters. Pattern, curve and customer point labels have the same limit of 64 characters.
You can relabel anything to match an asset register. For many labels at once, the fastest way is the Label column of the data tables, which accepts a paste. See Data tables.
Taking assets out of the run
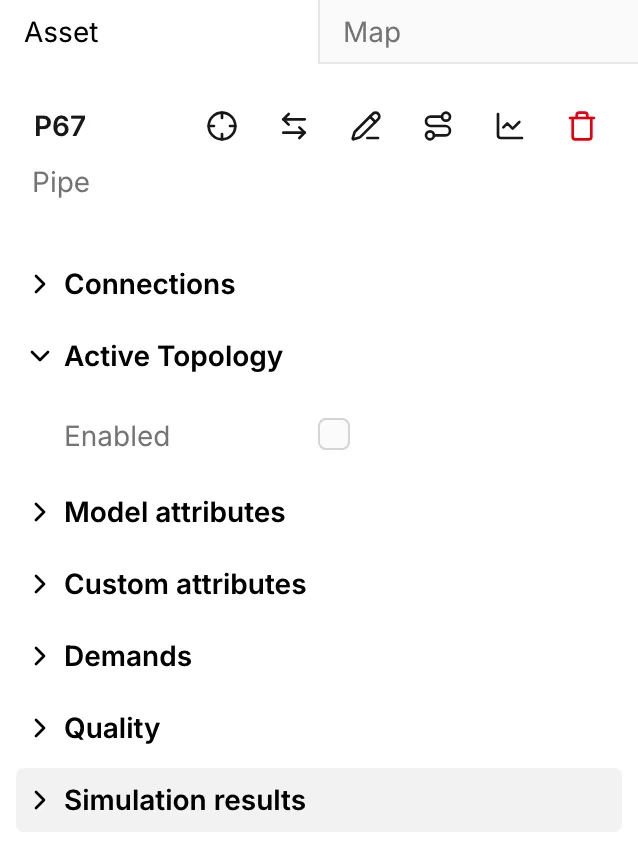
Section titled “Taking assets out of the run”Active Topology is the way the model says “this exists, but not right now”. A disabled asset stays in the project with all its properties. The app leaves it out of the run, out of the exported INP and out of the Network Review checks. The app draws it gray on the map, whatever the symbology says.
To disable an asset is not the same as to delete it. When you delete a pipe, the pipe is gone, together with any control that mentioned it. Only Undo brings it back.
You can disable a pipe, a pump or a valve in three ways:
- A, with the assets selected
- Disable in the panel header, or in the right-click menu on the map
- The Enabled switch in the Active Topology section
The same three ways enable the asset again. The action reads Enable when anything in the selection is disabled. Thus one key press makes a mixed selection fully enabled.
The run drops the controls that reference a disabled asset, and an exported INP leaves them out with the asset. Thus, when you disable a pump, no control tries to start it. The run also leaves out the patterns and curves that only disabled assets use. An export still writes the whole library. See Import and export.
Several assets
Section titled “Several assets”When you select more than one asset, the tab shows the multi-asset panel instead.
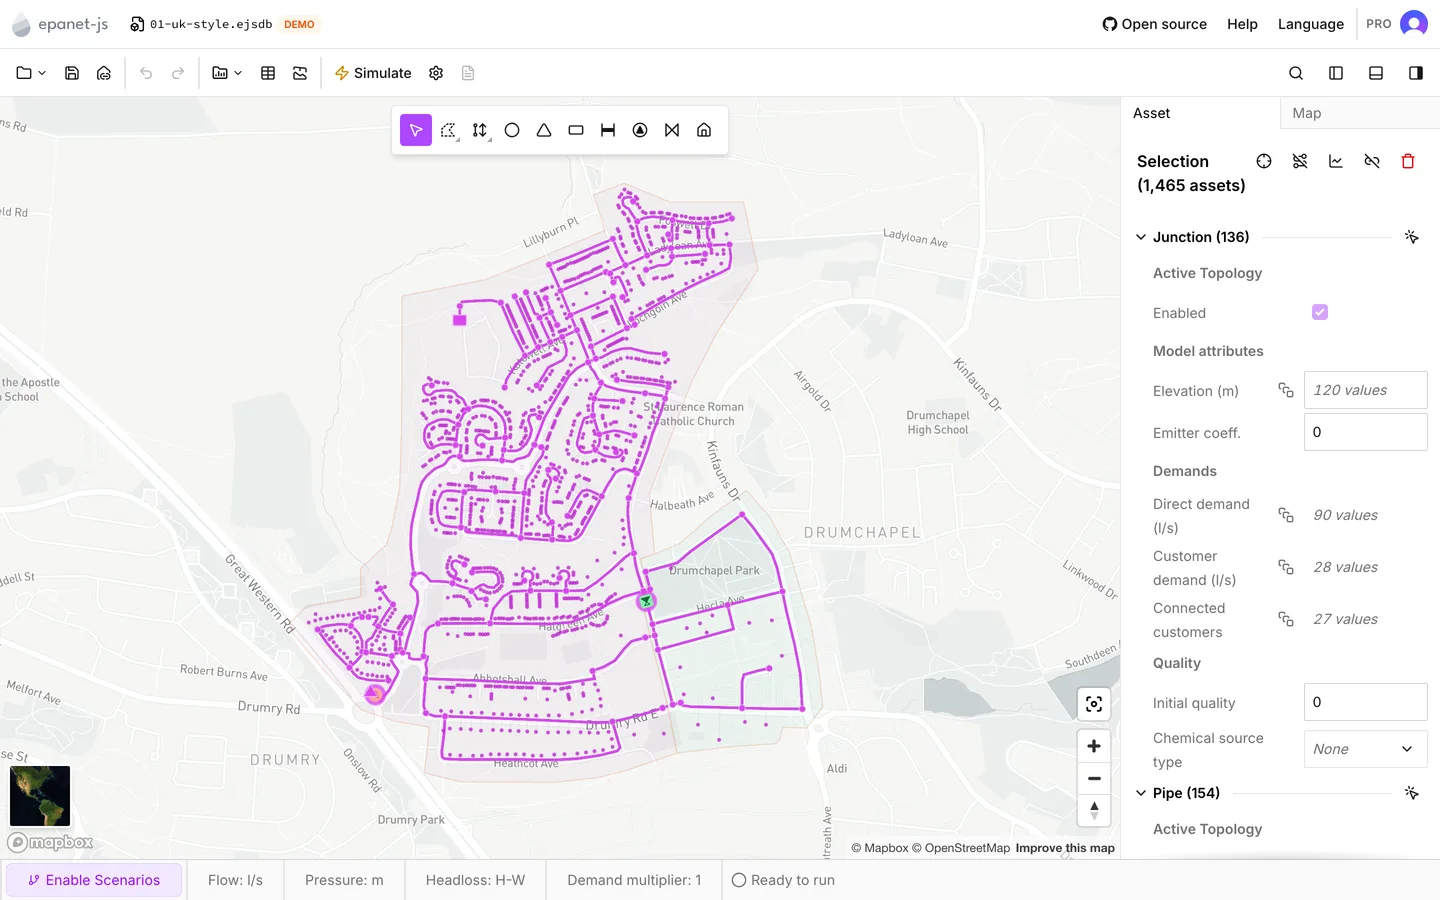
The header reads Selection, with the size of the selection in brackets. Its actions are Zoom to, Save selection, Enable / Disable, View graph, Disconnect customers and Delete. Disconnect customers appears only if the selection holds customer points.
Under the header is one collapsible section per asset type in the selection. The title of each section is the asset type and its count. A Customer points section appears when the selection holds customer points. When the selection holds more than one kind, each section header carries a button that narrows the selection to that one kind.
Inside a section, the same property rows appear, one row per property:
- Where every asset of that type shares a value, the row shows that value.
- Where the assets differ, the row shows a count of the distinct values, and a button appears beside the row.
- The button opens a summary. For a numeric property, the summary gives Min, Max, Mean and Sum. Under that is a list of the distinct values, against a Count of how many assets hold each value. You can sort both columns. When you click a row, the app selects only the assets with that value. This is how you get from “some of these pipes are 100 mm” to a selection of those pipes.
When you edit a row, the app writes the value to every asset of that type in the selection, in one undo step. You cannot set every property this way. You cannot set a label this way, and you cannot set anything the app computes. You can set the model attributes, the quality fields and the energy fields of a pump.
The panel leaves out the Simulation results and Energy results sections until there are results to summarize. It does not show them empty.
- Data tables — the same properties as a spreadsheet, for work down a list rather than across a network.
- Selecting and finding assets — how to get the right assets into the panel.
- Network review — the checks that read the active topology and report what is wrong with it.