
The map and its layers
The map is where the model is. Everything else in the window describes what the map draws. The panels read it, the checks measure it, and the tables list it. This page is about the map itself: how you move around it, what is drawn under the network, and how to add your own mapping.
Coloring the network by a property, labeling it and sizing the nodes are at the top of the same tab. See Symbology.
Moving around
Section titled “Moving around”Scroll or pinch to zoom. Drag to pan. A drag does not rotate the map, and the keyboard cannot rotate it either. The map stays north-up in normal use. A double-click does not zoom, because that gesture belongs to the drawing tools. There it finishes a link.
Controls sit at the bottom right, under the Mapbox attribution: zoom in, zoom out, and a compass that resets the bearing to north. Under them is a frame-shaped button with the tooltip “Fit to network”. It zooms the map to the extent of every asset in the model. The button does nothing on an empty project, and it frames the whole network rather than the selection. To frame what you selected, use Zoom to in the Asset tab or in the right-click menu.
The app does not save the position and the zoom of the map with the project. The fit-to-network button is thus the fastest way to find a network after you open it.
What else is drawn on the map
Section titled “What else is drawn on the map”Besides the network, several things float over the map rather than in a panel:
- At the top left, one legend for each color rule, after you color nodes or links by something. A click on a legend collapses it. See Symbology.
- At the top right, the Updating map… notice, and the playback speed warning during an extended period run.
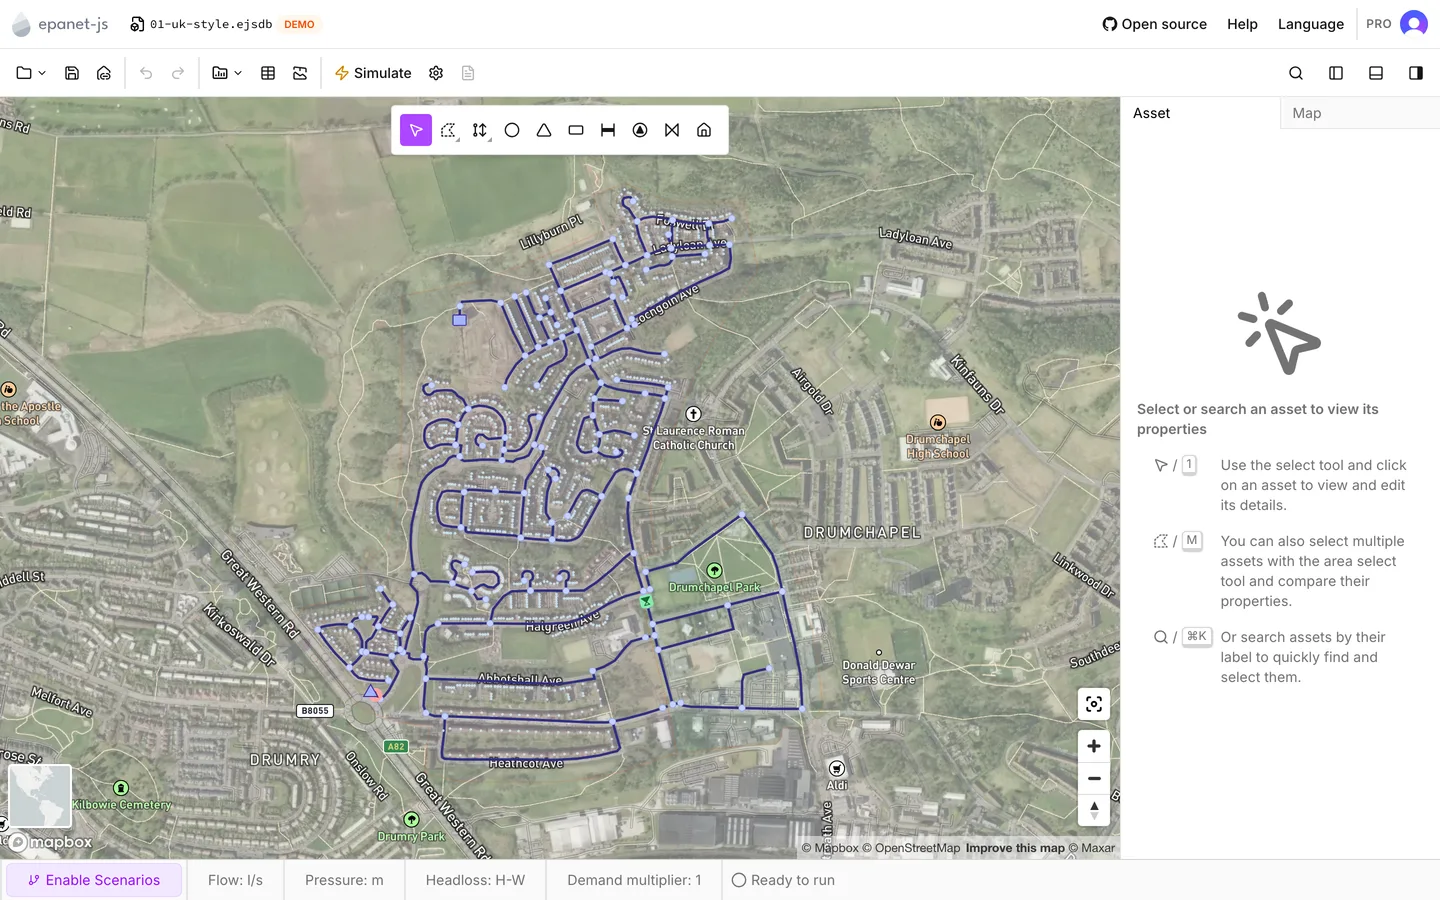
- At the bottom left, the base map thumbnail, described in Base maps. On an X-Y grid project a scale bar takes its place.
- Along the bottom of the map, a hint about your current action. See The interface.
Updating map… appears while the map rebuilds what it draws rather than patches it. The map rebuilds in five cases:
- On an import
- On an edit too large for the budget for incremental updates
- When the symbology or the layers change
- When a run finishes
- When you select more than 500 assets
On a large network this notice is the honest signal that the map is a second or two behind the model. Nothing is lost while it shows.
The Map tab
Section titled “The Map tab”Everything on this page and on Symbology lives in the Map tab of the side panel, on the right. The sections, from the top:
| Section | Shown | Covered in |
|---|---|---|
| Node symbology | Always | Symbology |
| Link symbology | Always | Symbology |
| Zone symbology | When the project has zones and your plan allows them | Symbology, Zones |
| Customer points | Always | Customer points |
| Elevations | Not on an X-Y grid project | Elevations |
| Layers | Not on an X-Y grid project | This page |
| Projection | Always | Projections |
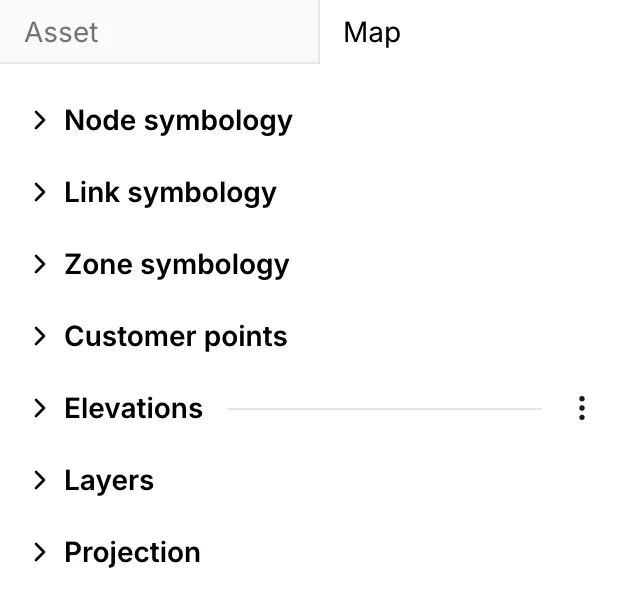
A click on the heading of a section collapses it. The browser remembers which sections you left open, not the project. While an extended period run plays back, the whole tab is read-only. You must stop the playback to change anything.
Base maps
Section titled “Base maps”Four base maps come with the app, all from Mapbox:
| Base map | What it is |
|---|---|
| Monochrome | A pale gray street map. The default, and the one that competes least with the network |
| Satellite | Aerial imagery with street labels over it |
| Outdoors | The outdoor style of Mapbox, with terrain, contours and paths |
| Streets | A full-color road map, from the navigation style of Mapbox |
You can change the base map in two ways. The Basemap row in the Layers section has a selector with all four. The square thumbnail at the bottom left of the map, and the B key, swap between Monochrome and Satellite only. The thumbnail shows the map you get from a click on it. The app hides the thumbnail when the base map is one of the other two. The app also hides it when you are offline, and on an X-Y grid project.
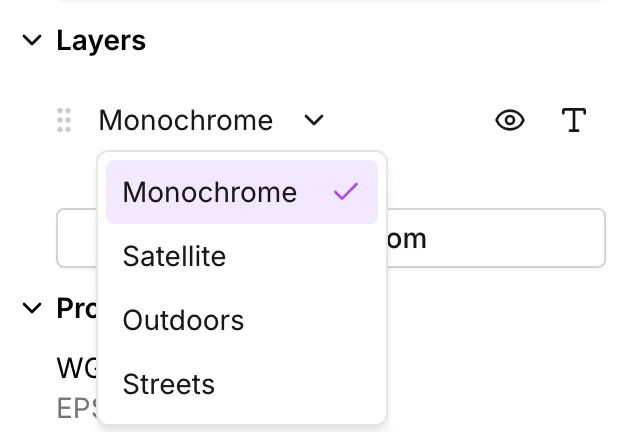
The app draws Satellite and Outdoors at 65% opacity, so the network stays readable over them. For Satellite, the Basemap row also carries an opacity box you can set yourself. Toggle labels visibility on the same row turns off the place names of the base map. This is useful before a screenshot of a dense area.
Satellite is the base map to draw over when you place assets against something you can see on the ground: a hydrant, a chamber lid, or the line of a main in a verge. It is the wrong base map to trust for anything you cannot see. The imagery is undated, and a main under a road is not in it.
Your own layers
Section titled “Your own layers”The Layers section lists every layer the map draws under the network, the base map included. Vector file layers come first, as their own group. The web service layers and the base map come after them, with the most recent at the top. The base map was there first, so it sits at the bottom. Drag the handle at the left of a row to reorder it.
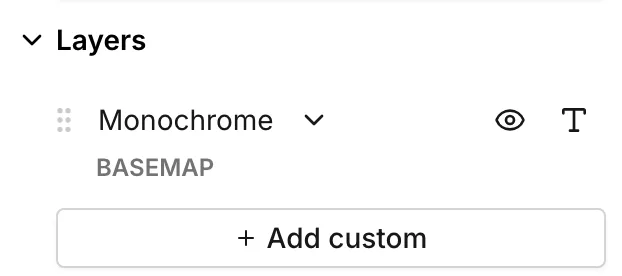
Add custom at the bottom of the section opens Choose type, which offers five kinds of layer in two groups:
| Group | Type | What it needs |
|---|---|---|
| Web services | Basemap | Nothing. The same four styles as the Basemap row |
| Web services | XYZ | A Name and a tile URL with {z}, {x} and {y}. A TMS checkbox is there for services that number tiles from the bottom |
| Web services | Mapbox | A mapbox:// style URL and an Access token |
| Web services | TileJSON | A Name and a TileJSON endpoint. When you press Add layer, the app fetches the URL. The app refuses a URL that does not return valid TileJSON |
| Local data | Vector file | A GeoJSON file, or a Shapefile. For a Shapefile, select the .shp with its .dbf, .prj, .shx and .cpg |
Every type except the base map is a paid feature. On the free plan, the other four show an Upgrade tag and open Upgrade to add custom layers instead. See Plans.
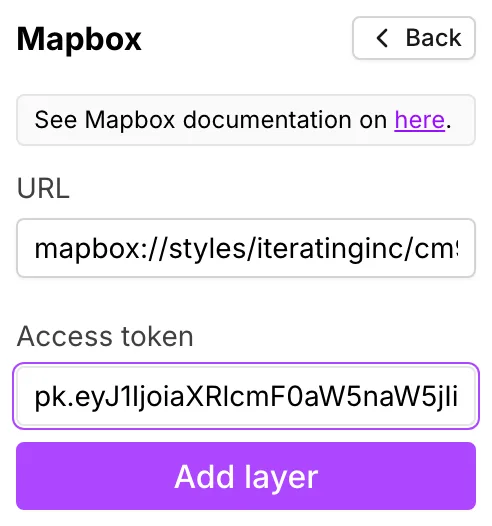
A web service layer is the right choice for data that somebody else maintains and that changes without you: an aerial survey, the tile service of a utility, or a terrain model. A vector file is the right choice for data you have as a file and want to see beside the network: a zone boundary, an asset register you compare the model against, or a scheme drawing exported from GIS.
Vector files
Section titled “Vector files”You can select several files at once. The app groups Shapefile parts back into their bundles by name. The app merges the files that return features into a single layer, named after the first of them.
The app accepts a Shapefile with no .prj only when its coordinates already
look like longitude and latitude. If they do not, the app rejects the file for a
missing projection. Any file that fails opens Vector file import errors.
Vector file import errors counts the failures and lists them by reason: an
unreadable format, an unknown or unsupported coordinate system, a failed
conversion, or a file with no features in it. The app still adds the layers that
parsed.
The settings button on a vector file row opens Name, Color, Line width and Opacity. When the file carries attributes, it also opens Labels. Choose a property there, and the map draws its values. Choose None to turn the labels off again.
What each row carries
Section titled “What each row carries”| Row | Controls |
|---|---|
| Base map | The four-style selector, an opacity box while the base map is Satellite, Toggle visibility, Toggle labels visibility |
| Mapbox | An edit button, Toggle visibility, Toggle labels visibility, Delete |
| XYZ, TileJSON | An edit button, an opacity box, Toggle visibility, Delete |
| Vector file | A settings button, Toggle visibility, Delete |
When you edit a web service layer, the app opens the form you made the layer with. The button then reads Update layer rather than Add layer. A TileJSON row that stops resolving shows a warning triangle next to its name.
On an X-Y grid project
Section titled “On an X-Y grid project”Some projects use a local grid for their coordinates rather than a real-world projection. Such a project has no base map and no Layers section, because there is nothing to align the network with. The map draws a grid instead, with a scale bar at the bottom left in the length unit of the project. When you set a projection in the Projection section, the grid becomes a real map. The base maps, the layers and the elevations come back. See Projections.
- Symbology — coloring the network by a result or an attribute.
- Elevations — where node elevations come from, and the sources you can add.
- Zones — importing zone boundaries and drawing them on the map.