
Reading results
A finished extended period run holds a full set of results for every reported timestep. There is one timestep every Reporting time step, from the start of the run to the Total duration. The app shows one of those timesteps at a time. The time browser in the toolbar chooses which one.
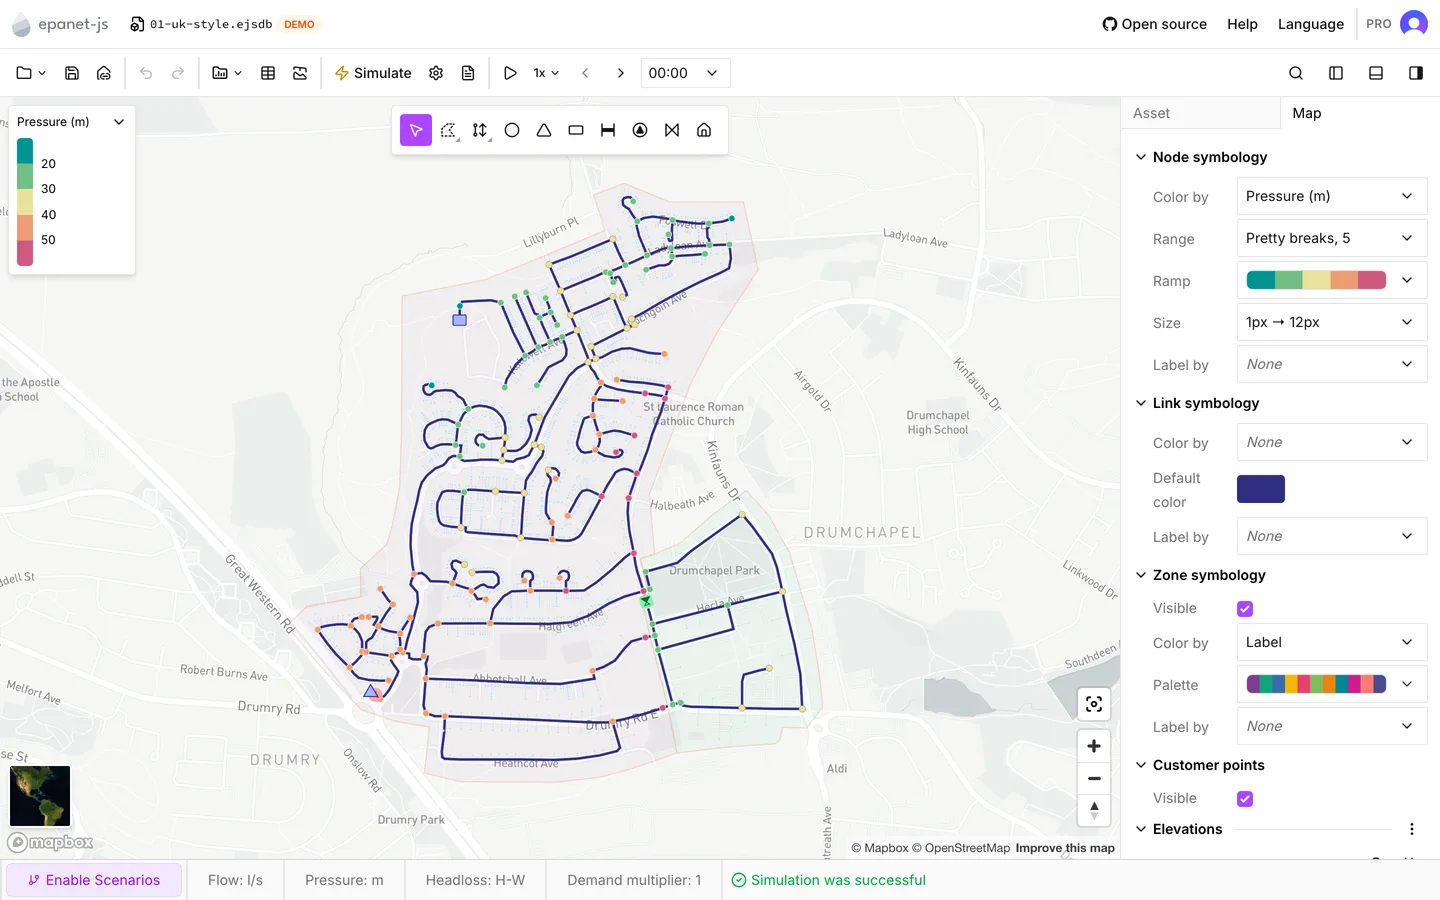
The app colors nothing on the map on its own. Each place that shows results reads the current timestep. After a run, set the map’s Color by to a result. Then move through time. See Running a simulation for the run itself.
Where the results turn up
Section titled “Where the results turn up”| Where | What it shows | Follows the timestep |
|---|---|---|
| Simulation results in the asset tab | Every result for one selected asset | Yes |
| Simulation results in the multi-asset panel | Minimum, maximum, mean and sum across a selection | Yes |
| The results columns of the data tables | One column per result, for every asset of a type | Yes |
| The map, once Color by is set to a result | The whole network at once | Yes |
| The HGL profile | Head and ground along a chosen path | Yes |
| Flow-based traces | Everything upstream or downstream of an asset | Yes |
| The graph at the foot of the asset tab | One property of one asset across the whole run | No. It draws every step |
| The simulation report | EPANET’s own text, with its warnings | No |
Before a run, those rows read Not available. They do the same on an asset that you draw after a run. The rows do not disappear.
The time browser
Section titled “The time browser”The time browser sits in the toolbar, to the right of Simulate, Simulation settings and View report. It appears only when a run produced more than one reported timestep. A steady state run has results but no time browser, because there is only one moment to show.
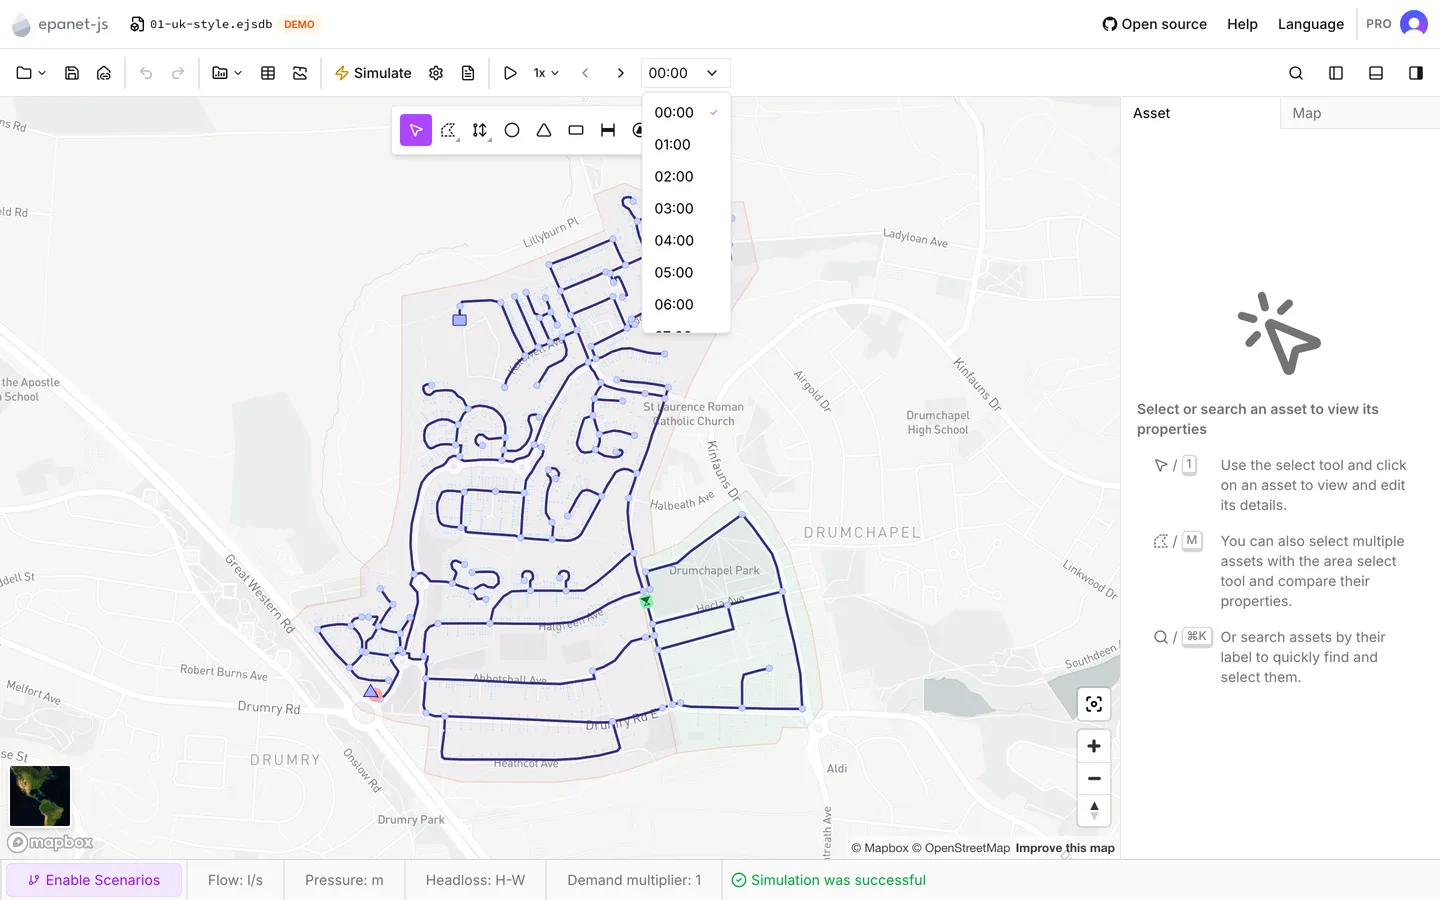
Left to right it holds Play simulation, the playback speed button, Previous timestep, Next timestep, and the current time. Click the time to open the list of every reported step. The list opens at the step you are on, with a tick against it.
The times are elapsed times, not clock times. They are in hours and minutes from
the start of the run. A 24-hour run reported hourly gives twenty-five entries,
from 00:00 to 24:00. You can change the Reporting time step in
Simulation settings. The next run then spaces the list
differently. This setting decides how finely you can move through the results,
and a finer step makes a larger set of results.
| Action | Windows and Linux | macOS |
|---|---|---|
| Play / pause | Shift+Space | ⇧␣ |
| Previous timestep | Shift+← | ⇧← |
| Next timestep | Shift+→ | ⇧→ |
The two step buttons gray out at the ends of the run. The shortcuts stop there too. See Keyboard shortcuts.
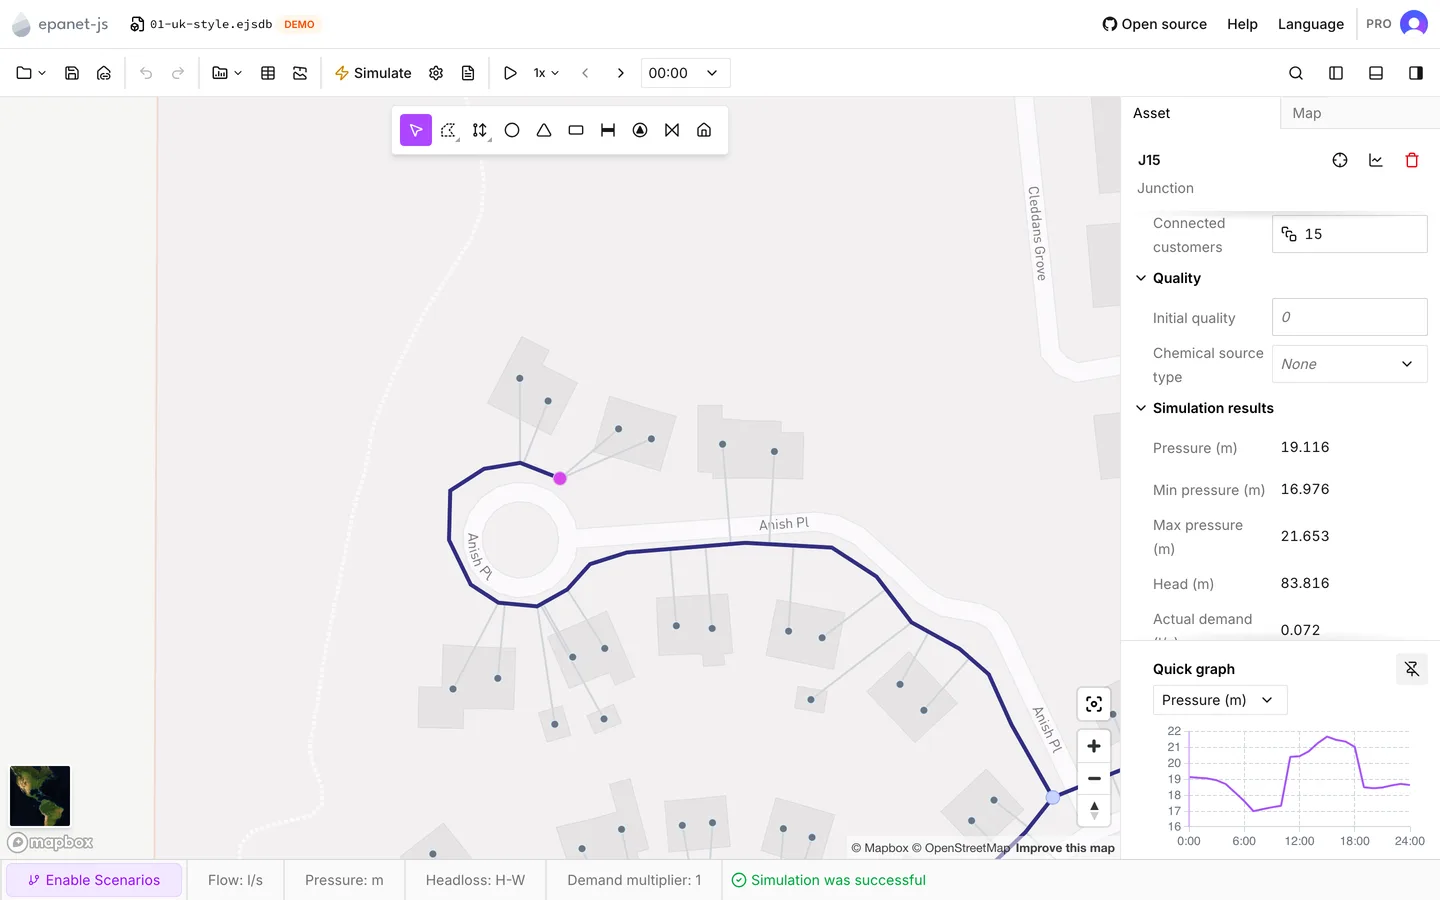
Click a point on the graph at the foot of the asset tab to move the run to that time. This is the quickest way to get from a peak on the graph to the state of the whole network at that moment. See Graphs.
On a window narrower than 1024 px, the time browser keeps only the time list. Play, speed and the two step buttons are gone, and you move with the shortcuts. On a window narrower than 640 px, the time browser disappears. See The interface.
Playing the run
Section titled “Playing the run”Play simulation (Shift+Space) steps forward on its own and redraws everything at each step. If you start it at the last step, it restarts from the beginning, so you do not need to rewind first. It stops on its own at the end of the run. It also stops when you open a dialog, start another run, step by hand, or open the time list.
Playback answers the questions that a single timestep cannot:
- The direction a main reverses in, and when
- How far a zone’s pressure goes down overnight
- How long a tank takes to recover
- Whether a pump cycles
Color the map by pressure or by flow first. With no color rule set, there is nothing to animate. See Symbology.
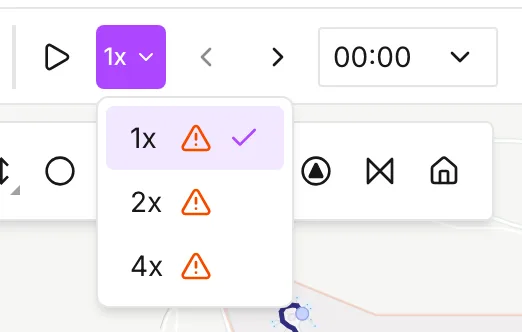
The speed button offers 1x, 2x and 4x. 1x is not one step per second. It is the app’s own measurement of how long a step takes to fetch and redraw, for this model in this browser. The app rounds that time up to a whole second, which gives one second on a small network and longer on a large one. 2x and 4x halve and quarter that interval. Both ask the map to redraw faster than the app measured it can.
Two warnings tell you when this happens:
- A warning triangle beside a speed in the menu, before you choose it.
- A message at the top right of the map during playback. The app shows Updating the map is taking over 1s per step — playback will be slow. when even 1x cannot keep up. It shows Results may not be visible before the next update at this speed. when the speed you chose is faster than the map can redraw.
Neither warning stops playback. The run still steps through every timestep, and the app draws over some of the steps before you can read them. The Updating map… notice in the same corner is the redraw itself. On a large network, watch that notice beside the two warnings. See The map and its layers.
When the results and the model disagree
Section titled “When the results and the model disagree”An edit after a run does not clear the results. They stay on the map and in the panel, and the time browser keeps working. Only the status bar changes: it goes to Simulation outdated. A pipe that you just resized is still colored by the flow it carried at its old diameter.
This behavior is deliberate, because it keeps the previous answer in front of you while you make the change. But look at the status bar before you read a number off the map. See Running a simulation.
In a scenario
Section titled “In a scenario”Each branch keeps its own results. When you switch between branches, the results switch with them, at the same timestep. A move back and forth gives you a direct before-and-after. The graph at the foot of the asset tab goes further and draws both series at once, the scenario against Main. For that, you must run both branches. See Scenario work and Graphs.
- Graphs — the graph in the asset tab, and building your own from a selection.
- Symbology — coloring the network by a result, and getting the ranges to suit the whole run rather than one timestep.
- The simulation report — the warnings and errors behind an outcome.
- HGL profile — head along a path, at the timestep you are on.