
Junctions
A junction is a connection point in the network. It is the only asset that can carry demand directly. Every pipe, pump and valve runs between two nodes. If you do not put a tank or a reservoir at a node, that node is a junction.
A junction gets into the model in three ways:
- You draw it with the Junction tool (2), or the app creates it for you at the end of a link you draw.
- You build it from your GIS data.
- The app reads it from an INP.
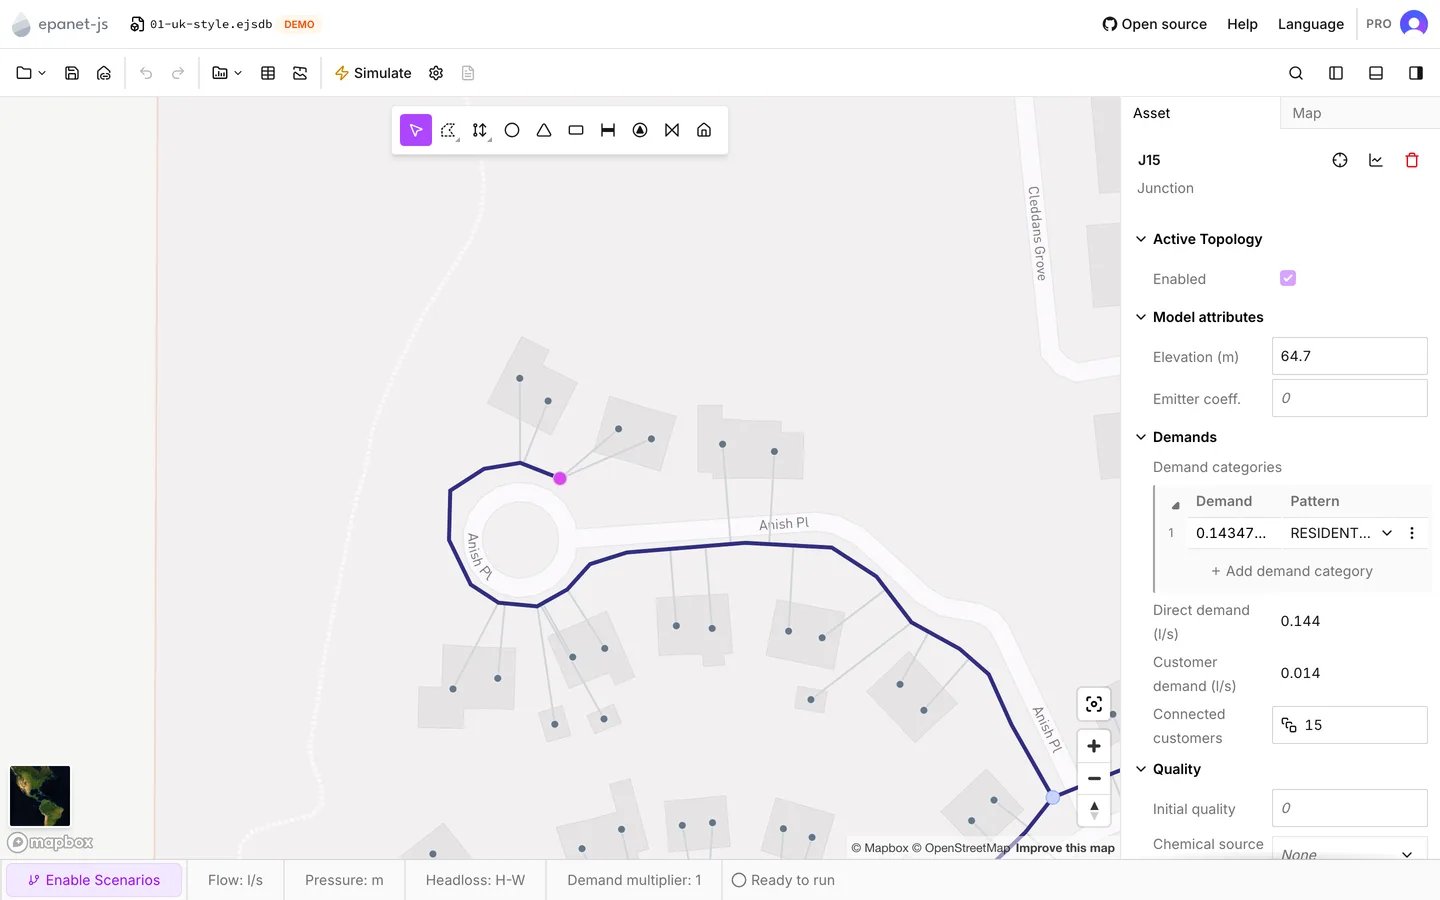
When you select a junction, the side panel opens on the Asset tab and shows its properties. See The Asset tab for the panel itself. See Drawing and editing for placing, moving and merging junctions.
Model attributes
Section titled “Model attributes”Elevation is the only property a junction must have, and it is in the project’s length unit. When you place a junction, the app reads the elevation from the terrain at that point. It reads the elevation again when you move the junction. If Auto-elevations is off, the app leaves the field empty for you. See Elevations for the sources it comes from and for the recalculation of a whole network.
The Model attributes check reports a junction with no elevation as Elevation missing, and that junction stops the run. See Network review.
Emitter coeff. is optional and carries no unit. If you leave it empty, the junction has no emitter. The app writes an emitter to the run only when the coefficient is more than zero. The exponent that goes with it is a project-wide setting. It is Emitter exponent in Simulation settings, and it starts at 0.5. See Simulation settings.
The app reports a negative value as Junction emitter coefficient should be zero or greater. For what an emitter represents, see the EPANET 2.2 manual.
Demands
Section titled “Demands”The Demands section holds two separate things. The first is the demand you put on the junction yourself. The second is the demand that reaches it from customer points connected to its pipes.
Demand categories
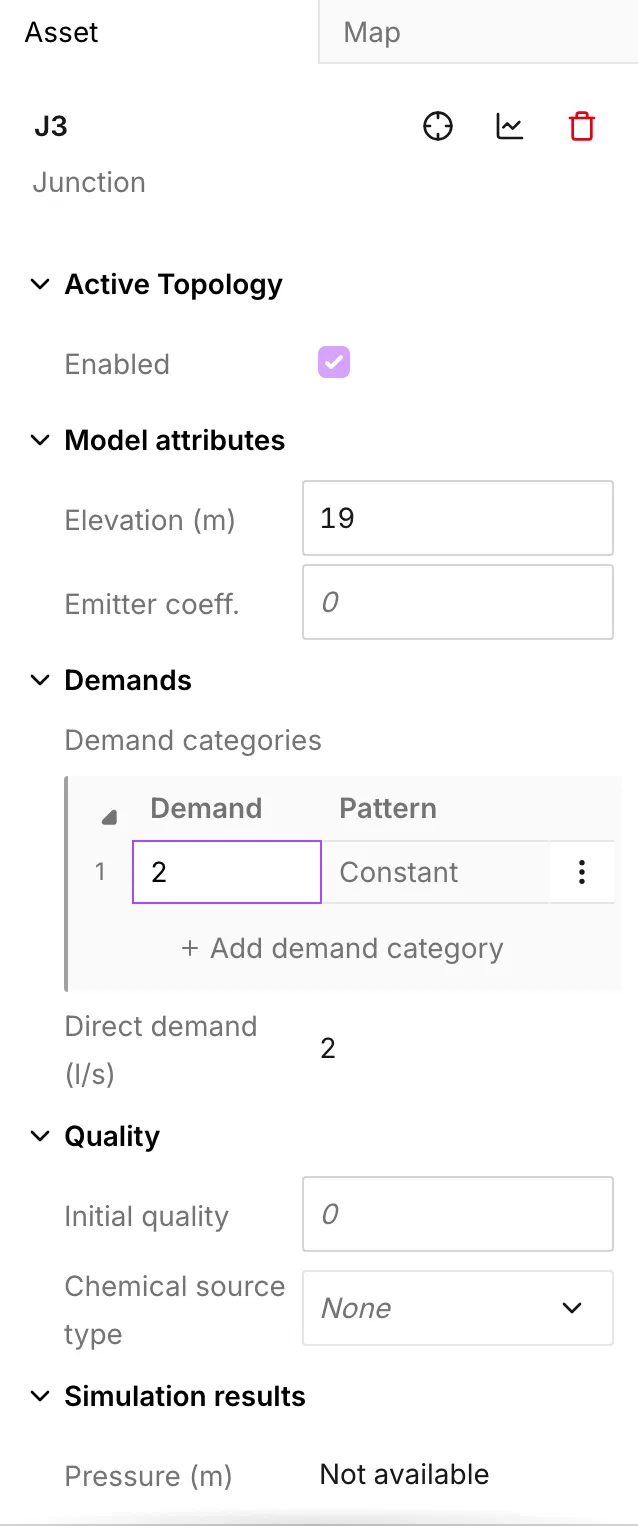
Section titled “Demand categories”Under Demand categories is a numbered grid with one row per category. The grid has two columns:
- Demand is the base demand, in the project’s flow unit. It can be negative, which is how you model an inflow at a junction.
- Pattern is a demand pattern from the project’s patterns, or Constant for none. The app offers only patterns of the demand type. See Patterns.
A junction with no demand at all shows a single Add direct demand button instead of the grid. When you press it, you get the first row. After that, Add demand category at the foot of the grid adds another row. The row menu beside each row offers Delete, Insert row above and Insert row below.
Categories are independent. With a second category and its own pattern, you can model two kinds of use on the same junction. An example is a residential profile together with a constant industrial draw.
When you set the only row that is left back to zero with no pattern, the app clears the demands. The Add direct demand button comes back.
Direct demand
Section titled “Direct demand”Below the grid, Direct demand is read-only. It is the average of every category over the run. The app multiplies the base demand of each row by the average of the multipliers of its pattern, then adds the rows together. A category with no pattern counts at its base demand. Direct demand is a summary of what you typed, not the demand at one timestep. After a run, Actual demand gives the demand at one timestep.
Customer demand
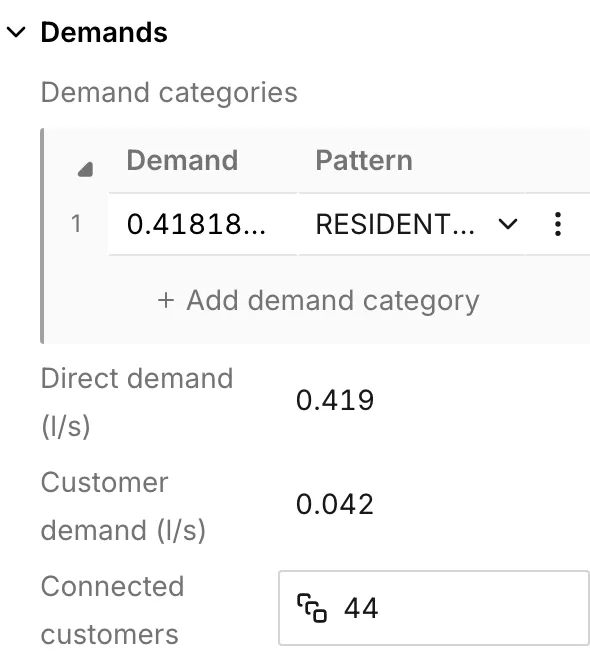
Section titled “Customer demand”When customer points are connected to the pipes at this junction, two more rows appear. A third row joins them when those points carry a pattern:
- Customer demand is the total of those customer points. The app averages it the same way as Direct demand.
- Customer demand pattern is read-only. It is the pattern that those customer points carry. It is there only when they have one. Customer points imported with no pattern give no row.
- Connected customers is a count. Click it for the list of them. While the list is open, the map highlights those customer points. As you move down the rows, the map highlights one point on its own.
Both kinds of demand reach the model. The app writes each category with a non-zero base demand as its own demand on the junction, with its pattern beside it. It adds the customer point demands as further demands, totaled per pattern. It leaves out the categories that sit at zero. See Customer points for where that demand comes from and how it is allocated.
Quality
Section titled “Quality”Initial quality is the concentration or the age that the junction starts the run at. The rows under it are Chemical source type, Source strength and Source pattern. These rows turn the junction into a source of chemical. Both parts mean something only when the quality analysis is on. See Water quality.
Simulation results
Section titled “Simulation results”After a run, this section gives these rows for the timestep that the time browser shows:
| Row | What it is |
|---|---|
| Pressure | The pressure at this timestep |
| Min pressure | The lowest pressure over the whole run |
| Max pressure | The highest pressure over the whole run |
| Head | The total head at this timestep |
| Actual demand | The demand that the engine delivered |
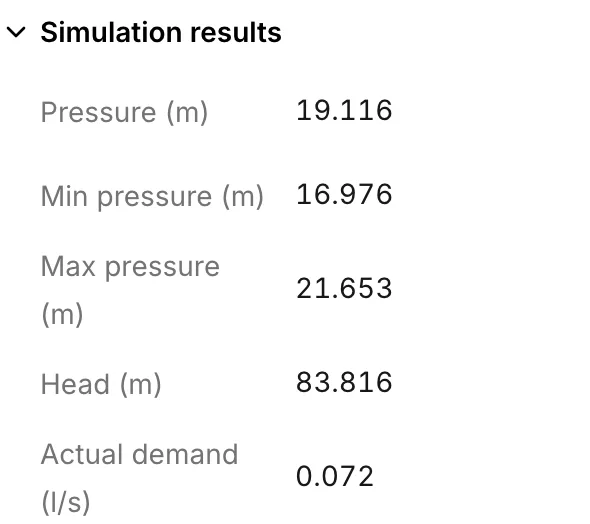
Min pressure and Max pressure are statistics over every timestep of the run, not over the assets. They are the lowest and the highest pressure that this junction saw at any point in the run. You do not have to step through the run to find them. On a single-period run they both equal Pressure. You can put both on the map from the Map tab. See Symbology.
Actual demand is what the engine delivered, which is the demand you asked for. If the Demand model of the project is a pressure driven analysis, and there is not enough pressure, the engine delivers less. See Simulation settings and Reading results.
When the run produces them, Water age, Water trace and Chemical join these rows.
Working on many junctions
Section titled “Working on many junctions”- When you select several junctions, the Asset tab shows the multi-asset panel. This panel can set Elevation, Emitter coeff., Initial quality and the chemical source rows across the whole selection at once. Demands are not among them. They stay per junction.
- The Junctions tab of the data tables takes a paste down a column. This is the fast way to get the elevations of a survey or the demands of a spreadsheet into the model. It shows Base demand and Pattern for the first category only, so junctions with more than one category need the panel.
- Graphs plots Pressure, Head or Actual demand at one junction across the whole run.
- Patterns — the profiles that the Pattern column offers.
- Customer points — demand from a property database rather than typed on the junction.
- Pipes — the links between junctions.