
Import and export
File > Export has three entries. Each entry answers a different question. The entry you want depends on what will open the file.
| Entry | Produces | For |
|---|---|---|
| EPANET INP | One .inp |
The model itself, for EPANET or another modeling tool |
| Asset data | GeoJSON, CSV, Shapefile or XLSX | The network as attributes and geometry, for GIS or a spreadsheet |
| Simulation results | CSV or XLSX | The whole time series of a run, for work outside the app |
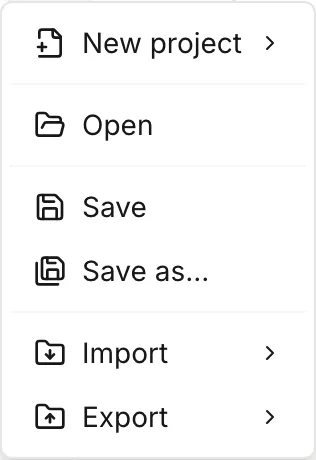
None of these three entries keeps your work. Save does that, because it writes an epanet-js project. See Projects. Every export on this page is a one-way copy. If you change the model afterwards, the exported file does not change with it.
The Import submenu beside it takes customer points and zones. Each one has its own page. See Customer points and Zones. A whole model comes in through File > Open, and not through Import. See Bring in an existing model.
EPANET INP
Section titled “EPANET INP”File > Export > EPANET INP writes the model as an EPANET input file.
It always asks you where to put the file, because it keeps no memory of a file
it wrote before. Save does keep that memory. The name it suggests is the INP
the model came from, the project name with the extension swapped, or
my-network.inp.
The warning first
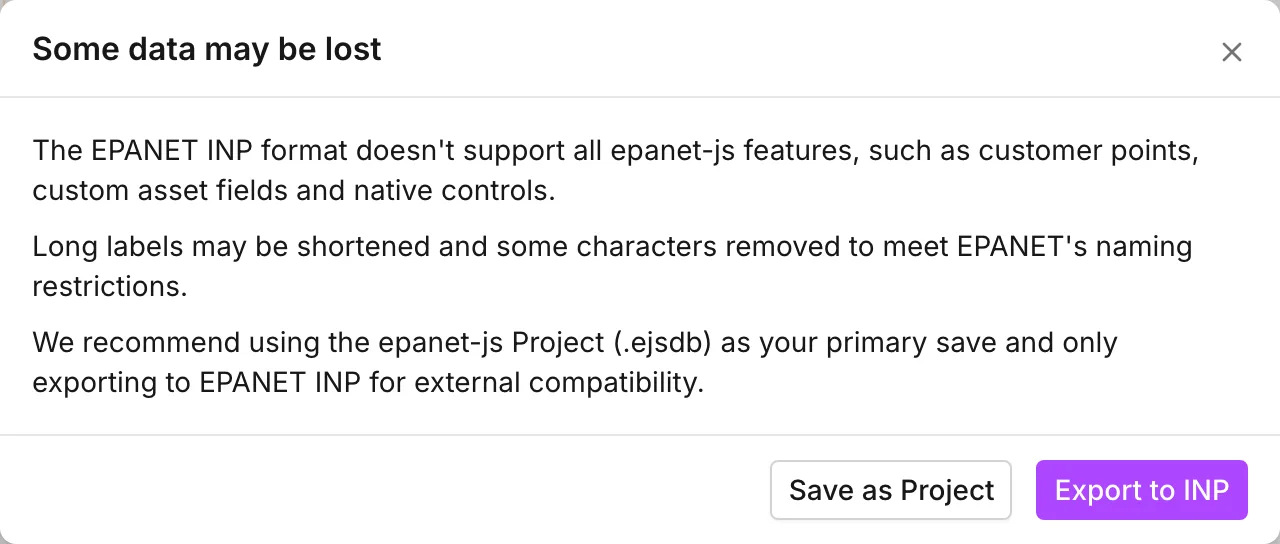
Section titled “The warning first”Some data may be lost opens before the app writes anything. The dialog says that the INP format does not support all epanet-js features. It warns that the app can cut long labels and remove some characters, to meet the naming restrictions of EPANET. It also tells you to keep the project file as your main save, and to export an INP only for use in other tools.
When the model has a PRV with a Target node, the dialog opens with an
LSX Required box. The file then carries that regulation in a [SCRIPT]
section, which standard EPANET cannot run. The box links to EPANET-LSX, which
can run it. Know more lists Remote set-point PRVs, with the labels of up to
three of them. See Valves.
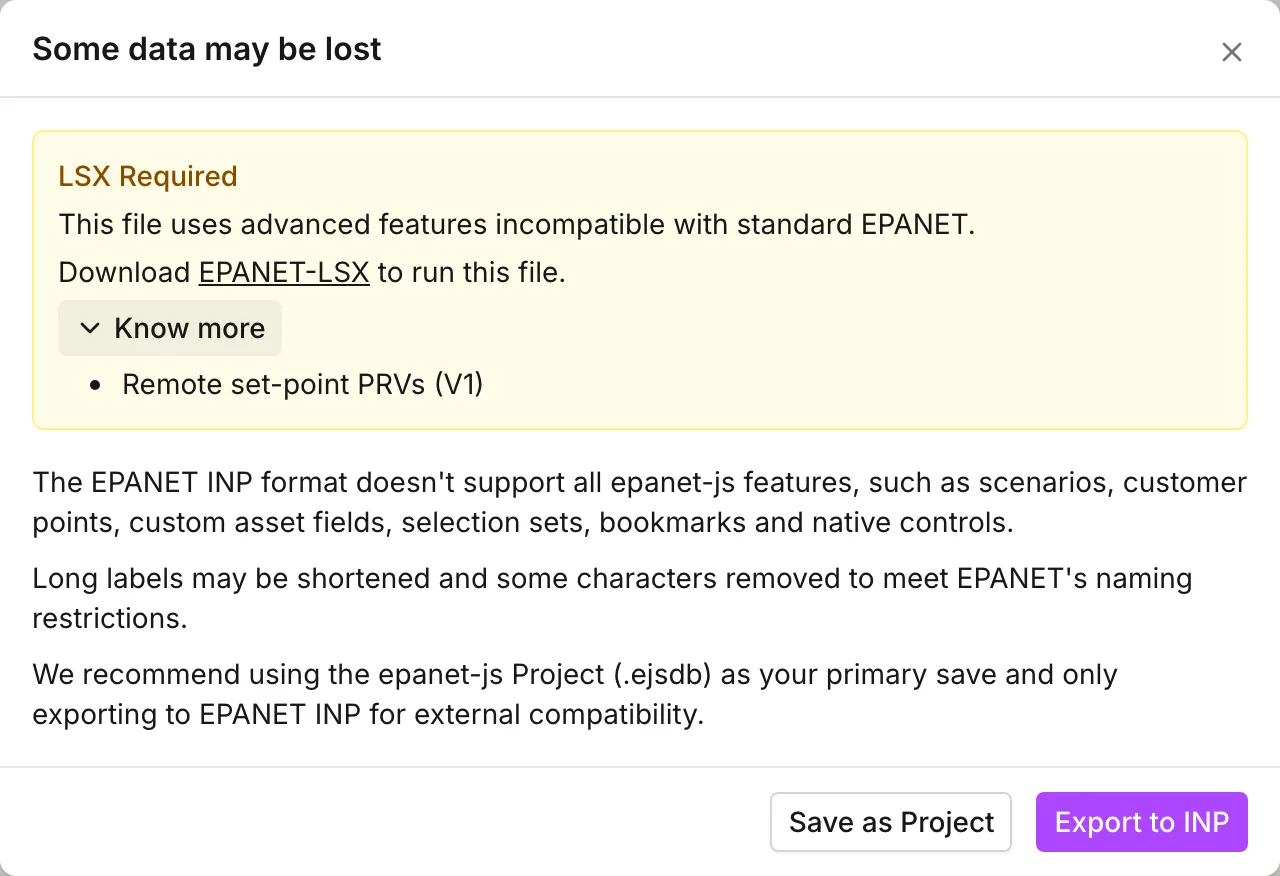
The dialog has two buttons and a way back out:
- Export to INP continues with the export.
- Save as Project writes a
.ejsdbfile instead. This is the right answer if what you wanted was to save your work. - The cross and Esc close the dialog and stop the export.
What the file carries
Section titled “What the file carries”The file carries everything that EPANET has a section for:
- The six asset types with their attributes
- Demands, patterns, curves and emitters
- Status, controls and rules
- Quality, reactions and energy
- The
[OPTIONS]and[TIMES]sections, which hold your units, headloss formula and simulation settings
Coordinates go into [COORDINATES] and [VERTICES], in the projection of the
project. The app declares the units in [BACKDROP]. As a result, a network
built on a map comes out in the coordinate system you set, and not in longitude
and latitude. See Projections. The file starts with a
;MADE BY EPANET-JS comment.
Two more details:
- Asset labels become the EPANET IDs, and pattern and curve labels do the same.
The app allows 64 characters, but EPANET allows only 31. The app cuts a longer
label to 31 characters, and removes the whitespace, semicolons, commas and
double quotes that EPANET cannot carry in an ID. If that leaves two IDs the
same, the file numbers them apart (
.1,.2), so every ID in the file is still unique. The model itself does not change, because the shorter labels are in the file and not in your project. See The asset tab. - The app writes the whole pattern and curve library, and not only the parts that the model uses. A run builds a leaner file, but an export does not. Unused patterns and curves travel with the model.
What it does not carry
Section titled “What it does not carry”| Not in the file | Where it survives |
|---|---|
| Customer points | The project file. The demand of the points is not lost. The app adds it to the junction that each point connects to, groups it by pattern, and writes it into [DEMANDS] |
| Custom attributes | The project file only |
| Zones | The project file only |
| Native pump controls | The app writes them as ordinary EPANET control statements, so the behavior survives. If you open the INP again, you get text controls and not the native editors |
| Symbology and custom layers | Nothing. They are a view and not part of the model, and the app does not save them anywhere |
| Scenarios | The project file only. See With scenarios open |
| Selection sets and bookmarks | The project file only. See Collections |
See Customer points, Custom attributes, Zones and Controls.
The file does not carry the assets that you took out of the active topology. It also does not carry a control or a rule that references them. A run skips the same statements.
With scenarios open
Section titled “With scenarios open”An INP holds one model, so the app always writes the main model. If you are on a scenario, the export still writes the main model and not that scenario. The scenarios stay in the project file, and Save keeps them there. See Scenario work.
While it runs
Section titled “While it runs”A toast reads Generating INP… and then Exported as INP. If you close the picker, the toast reads Canceled exporting INP. A model with a very large number of assets can fail with Model is too large to export as INP. The app builds the whole file in memory before it writes it, and that memory is the ceiling.
Asset data
Section titled “Asset data”File > Export > Asset data opens Export asset data. This export gives the network as attributes and geometry, with one dataset per asset type, for QGIS, ArcGIS or a spreadsheet. It is not a model file, and you cannot run what it writes.
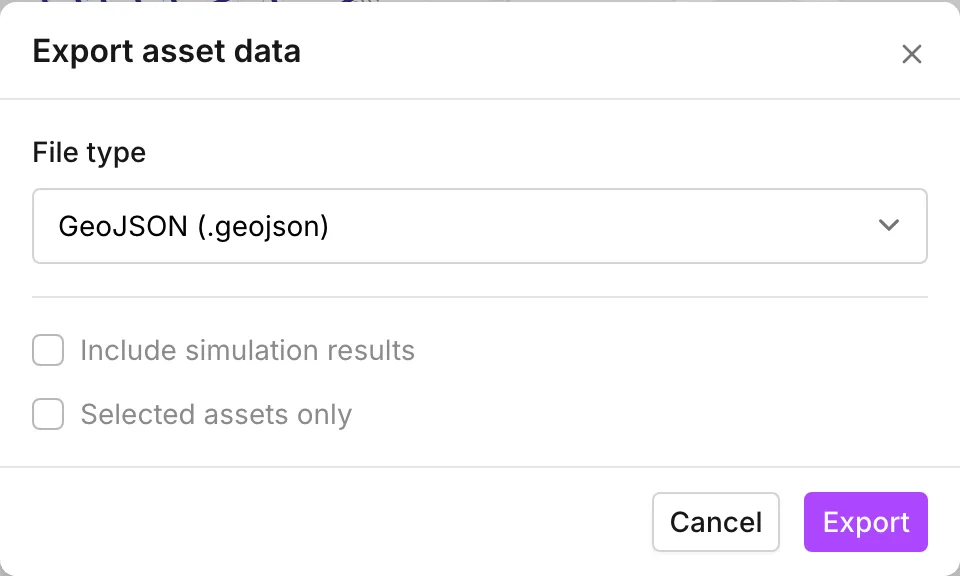
File type offers four:
| Option | What you get |
|---|---|
| GeoJSON (.geojson) | A .zip file with one .geojson per asset type. Each one declares the CRS of the project. If the coordinate system of the project has no EPSG code, the files are in longitude and latitude (WGS 84) and declare no CRS |
| Comma-Separated Values (.csv) | A .zip file with one .csv per asset type. The nodes carry X and Y columns |
| Shapefile (.zip) | A .zip file with .shp, .shx, .dbf, .prj and .cpg per asset type |
| Microsoft Excel spreadsheet (.xlsx) | One workbook with one sheet per asset type |
The datasets are junctions, reservoirs, tanks, pipes, pumps, valves
and customer-points. The app names them from the project file and adds
-export.
The dialog has two checkboxes:
- Include simulation results adds the results of each asset to its attributes. The columns are named for the property, with Simulation after it in brackets. After a run of more than one timestep, the label changes to Include results at current step, with the time of that step beside it. The export is then a snapshot at the position of the time browser, and not a time series. For a time series, use Simulation results. This checkbox is unavailable until a run produces results.
- Selected assets only narrows the export to the current selection, customer points included. If you select nothing, this checkbox is unavailable. See Selecting and finding assets.
Export writes the file. Cancel closes the dialog. A toast reads Exporting… and then Exported successfully, or Export failed. On a project with no assets, the dialog tells you so and does not offer the options.
The column names are the property names as the interface shows them, in the language of the interface. For example, an export in French gives French column names. See Languages.
The export includes custom attributes under their own labels, in all four formats. See Custom attributes. For each PRV that has a target node, the valves also carry the label of that node. See Valves.
For a single table rather than the whole model, the data tables copy as tab-separated text straight into a spreadsheet. See Data tables.
Simulation results
Section titled “Simulation results”File > Export > Simulation results opens Export simulation results. It writes the whole time series of the last run: every asset, and every reporting timestep. This is the export for work that the graphs of the app cannot do. Examples are statistics across a run, comparisons between runs, and a report that someone else builds in Excel.
This export needs results. If there are none, the dialog says No simulation results were found. Run a simulation first to export time-series data. See Running a simulation.
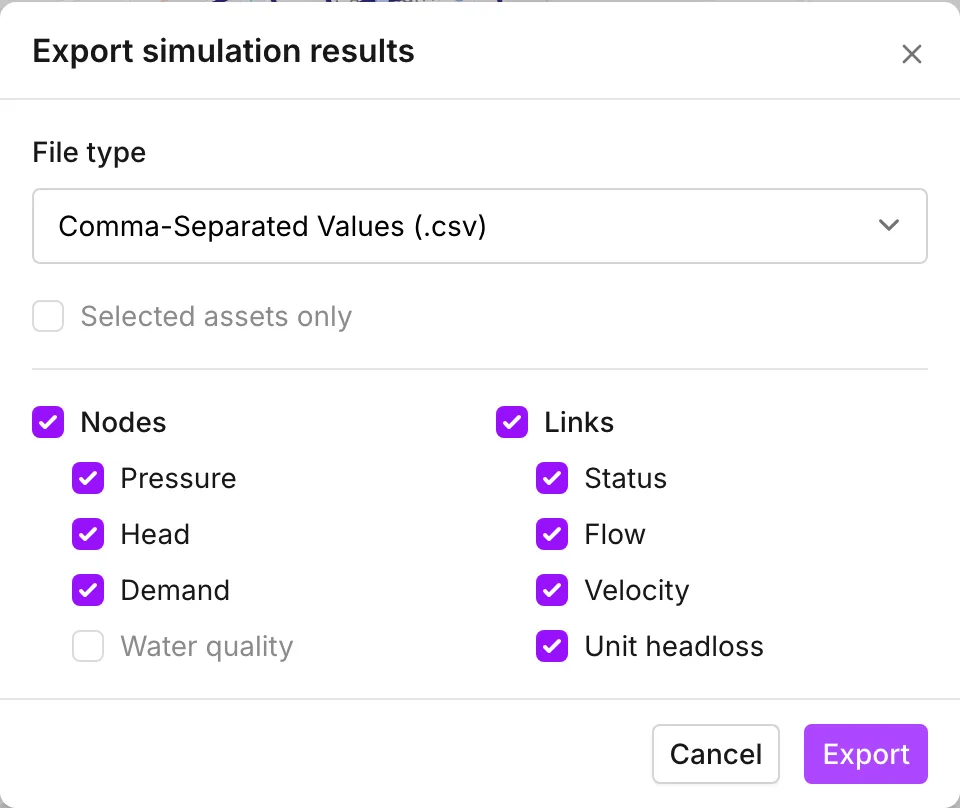
File type is Comma-Separated Values (.csv) or Microsoft Excel spreadsheet (.xlsx). The two give the same numbers in different containers:
- CSV gives a
.zipfile with one file per property. Each file has one row per asset:id, thentype, then one column per reporting timestep. The head of each column is the time of that step. - XLSX gives one workbook with one sheet per property, in the same layout.
Under the file type is Selected assets only. Then come two columns of checkboxes:
| Nodes | Links |
|---|---|
| Pressure | Status |
| Head | Flow |
| Demand | Velocity |
| Water quality | Unit headloss |
All eight start ticked. The heading of each column is itself a checkbox, and it turns the four boxes under it on or off together. Water quality is unavailable if the run had no quality analysis set. See Water quality. If you untick everything, Export becomes unavailable, because there is nothing to write.
The app estimates the file again after every change to the checkboxes, the format or the selection. These files get large quickly. The row count is the number of assets multiplied by the number of properties, and the column count is the number of reporting steps.
At about a gigabyte, the dialog shows Large export size (~1.0 GB). It tells you to narrow the data or to reduce the number of steps. The export is still permitted.
A browser that cannot write directly to disk must stage the file in browser storage first. There the app compares the estimate with the storage quota that is left. If the estimate is over the quota, the dialog turns red with Maximum export size exceeded (~1.0 GB), and Export is unavailable. Chromium has no such ceiling.
You can make the file smaller in three ways, in the order worth trying:
- Select the assets you want, then tick Selected assets only.
- Untick the properties you do not need.
- Lengthen the reporting timestep in Simulation settings. This cuts columns and not rows.
While it runs
Section titled “While it runs”Export replaces the dialog with Exporting results. A progress bar names the property that the app writes and the percentage done. The dialog then shows Saving files while the app closes the archive. Cancel stops the export partway. The export finishes on Export complete, and OK closes the dialog.
For a narrower slice of the same data, a custom graph exports its own series from the graph itself. It uses the same exporter and gives the same shape of file, with two properties and a selection. See Graphs.
- Projects — saving, which keeps your work.
- Bring in an existing model — the other direction, and what an INP import asks you.
- Projections — the coordinate system of every export.
- Data tables — copying one table out without a file.
- Graphs — reading a time series inside the app.