
Data tables
The data tables show the model as a spreadsheet. There is one tab per table that you open, one row per asset, and one column per property. Use the tables when the job is a list and not a network. For example, you can make sure that every pipe has a diameter. You can paste a column of elevations from a survey, or find the six junctions that have no demand.
Data tables in the toolbar opens the Open data tables dialog. It lists one table per asset type, with the number of rows in each one in parentheses. The types are Junctions, Pipes, Pumps, Valves, Reservoirs, Tanks and Customer points. Tick the tables that you want and press Open. Each one becomes a tab in the bottom panel.
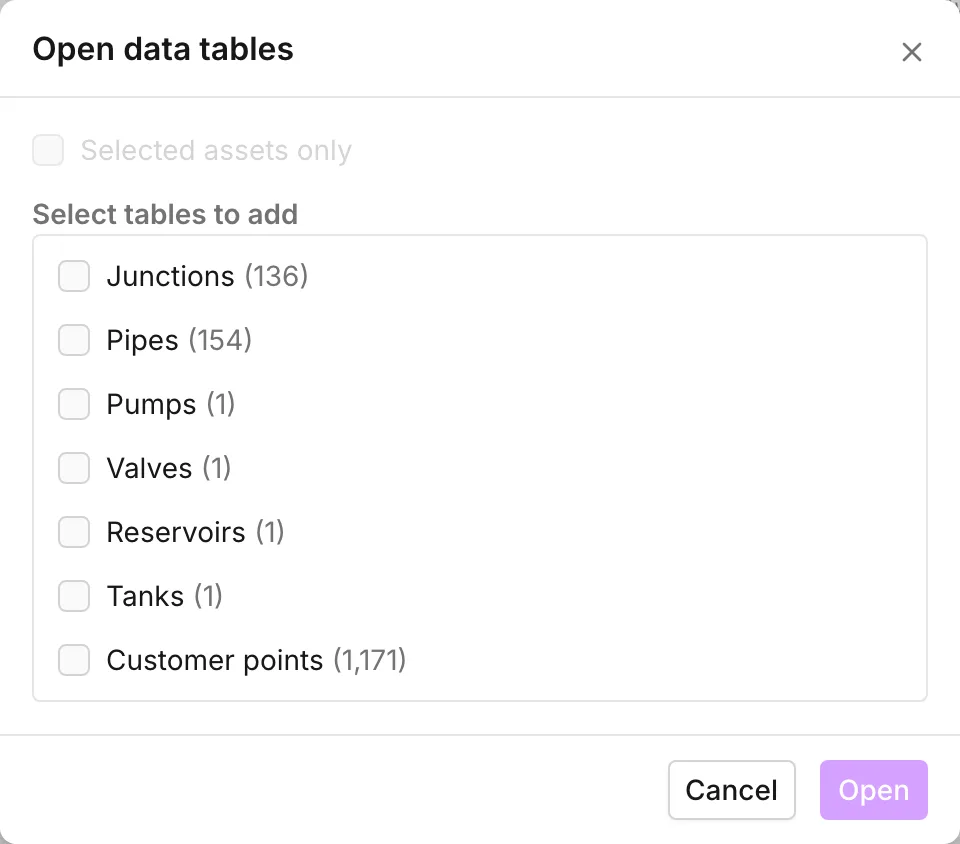
The panel holds no table until you open one, and you can open the same table more than once. Selected assets only in the dialog limits the tables to the current selection. See What the tables cannot do. Ctrl+J shows and hides the panel from anywhere. When a profile exists, a HGL profile tab appears.
While the panel is empty, it reads Nothing here yet, with a line for each of the two things that can live there. Once it holds tabs, each tab has an × that closes that tab alone. You can drag a tab along the strip to change the order. When there are more tabs than fit across the panel, Scroll tabs left and Scroll tabs right appear at the ends of the strip. Each press brings the next hidden tabs into view, and the scroll wheel moves the strip sideways too. The tab that you are working in always stays in view.


The columns
Section titled “The columns”Label is the first column. It stays fixed on the left when you scroll sideways, so you always know which row you are on.
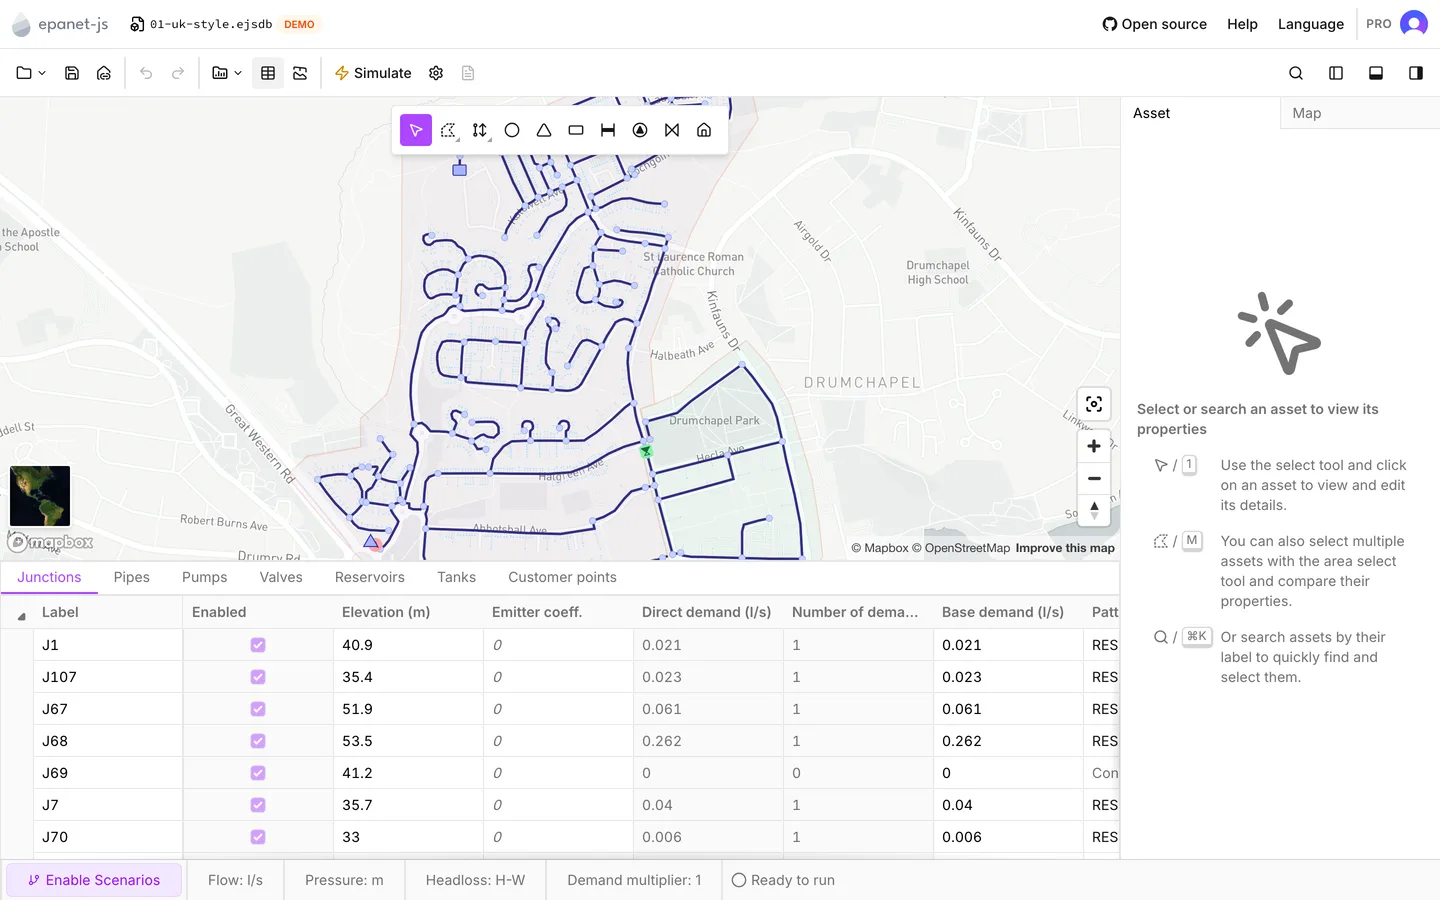
The columns after Label come in this order:
- Enabled
- The connections of a link (Start node and End node)
- The model attributes of that asset type, in the same order as the Asset tab
- Any custom attributes that the project defines
- The results columns.
The results columns appear only after a run produces results. They show the values for the timestep that the time browser shows.
Some columns are read-only because the app calculates the value and does not store it: Start node and End node, Direct demand, Number of demands, Connected customers, Customer demand, and everything on the results side. The Enabled column is editable for pipes, pumps and valves, and read-only for nodes. The Asset tab uses the same rule.
Target node on the Valves tab is read-only too. On a PRV row, it names the node at which the valve holds its pressure. On the rows of other valve types, it reads None. You set the target node in the Asset tab. See Valves.
Working in the grid
Section titled “Working in the grid”The grid works like a spreadsheet.
| Key | What it does |
|---|---|
| Arrow keys | Move between cells |
| Enter | Start an edit, or accept the value and move down |
| Esc | Cancel the edit, or clear the selection |
| Tab / Shift+Tab | Move right and left |
| Delete / Backspace | Clear the cell |
| Any character | Start an edit with that character |
| Ctrl+C | Copy the selected cells as tab-separated text |
| Ctrl+V | Paste into the selection |
To select a block of cells, click one cell and then shift-click another. To select a whole column, click the column header. To select everything, click the box at the top left of the grid. To change the width of a column, drag the edge of its header.
To sort, point at a column header and open the More actions menu that appears on it. The menu has Sort ascending and Sort descending. Sorting changes the order that you see, and not the model. The row menus still work on the rows in their sorted order.
Each table keeps its own state while you work in another tab. When you come back to it, the sort, the column widths, the selection and the scroll position are all still there. When you close the tab, the app discards them.
Copying and pasting
Section titled “Copying and pasting”Copy takes the selection as tab-separated text, which pastes directly into a spreadsheet. If you copy a whole column, the app also offers Copy with headers, which adds the column name. To get a whole table out in one step, use Export > Asset data in the toolbar. See Import and export.
Paste writes into the cells from the top left of the selection outward, in one undo step, and skips read-only columns. This is the fastest way to get a spreadsheet of diameters or elevations into the model. It is why the worked examples use the tables and not the panel when there are thirty numbers to enter.
Getting from a row to the map
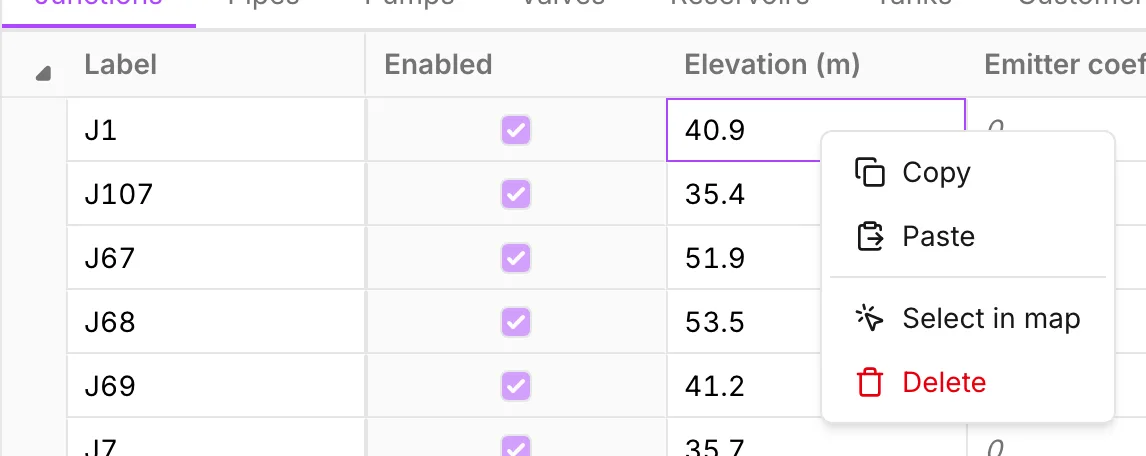
Section titled “Getting from a row to the map”When you right-click a cell or a row, the menu gives two commands:
- Select in map selects the assets in the rows that you selected, and zooms the map to them. This is the way back from a list to the network. For example, sort by pressure, select the bottom twenty rows, and see where they are.
- Delete removes those assets from the model, with everything that follows from it. See Selecting and finding assets for what the app deletes together with a node.
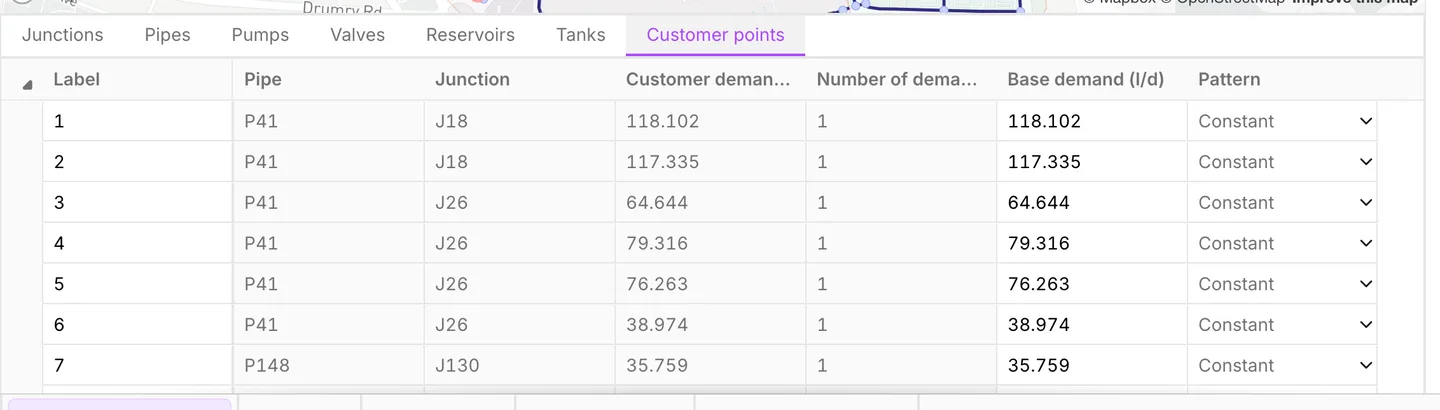
On the Customer points tab, Select in map is not available while the map hides customer points. To use it, show them again from the Map tab. See Customer points and Symbology.
What the tables cannot do
Section titled “What the tables cannot do”The tables edit the same model as the Asset tab, one property at a time. Anything that the panel treats as more than a single value stays in the panel: demand categories after the first, the controls of a pump, the volume curve of a tank, and a chemical source.
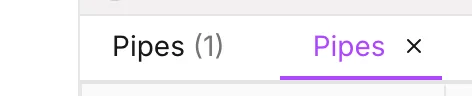
The tables cannot filter rows either. To work on a subset, select it on the map. Then tick Selected assets only in the Open data tables dialog. The tables that you open then hold the selected assets only. Each tab carries its row count in parentheses beside the name, so a scoped Pipes tab can sit next to the full one. While you have no selection, the checkbox is not available. For a subset that no selection describes, sort by the column that separates it.
The grid becomes read-only with the rest of the app in two cases: while a simulation plays back, and while you are on Main and a scenario exists. See Scenario work.
- The Asset tab — the same properties, one asset at a time, with the sections that the grid cannot show.
- Custom attributes — how to add your own columns.
- Import and export — how to move whole tables in and out.