
Zones
A zone in epanet-js is a named polygon that you bring in from GIS. The app takes no position on what a zone stands for. It can be a DMA, a pressure zone, a supply area, or a council boundary. Nothing in the hydraulics reads it. Zones give you the areas of the network drawn and named on the map. They also give you a way to confine a customer point allocation to one area.
Zones are a paid feature, except on the demo networks. On the free plan the import opens Upgrade to import zones. See Plans.
Getting zones in
Section titled “Getting zones in”File > Import > Zones opens the Import zones wizard. Before you start:
- You need a GeoJSON file, a Shapefile, or a DXF drawing (
.dxf). A Shapefile is the.shptogether with its.dbfand.prj. If there is a.cpg, it is part of the Shapefile too. - The wizard reads only
PolygonandMultiPolygongeometries. It skips all other records in the file. The first step says how many records it skips: 3 records are not polygons and will not be imported as zones. If the file has neither of the two geometries, the wizard refuses it with The file does not contain any Polygon or MultiPolygon geometries. - On an X-Y grid project, the menu entry is grayed out, because the polygons have nothing to align with. You must give the project a projection first. See Projections.
-
Add the file
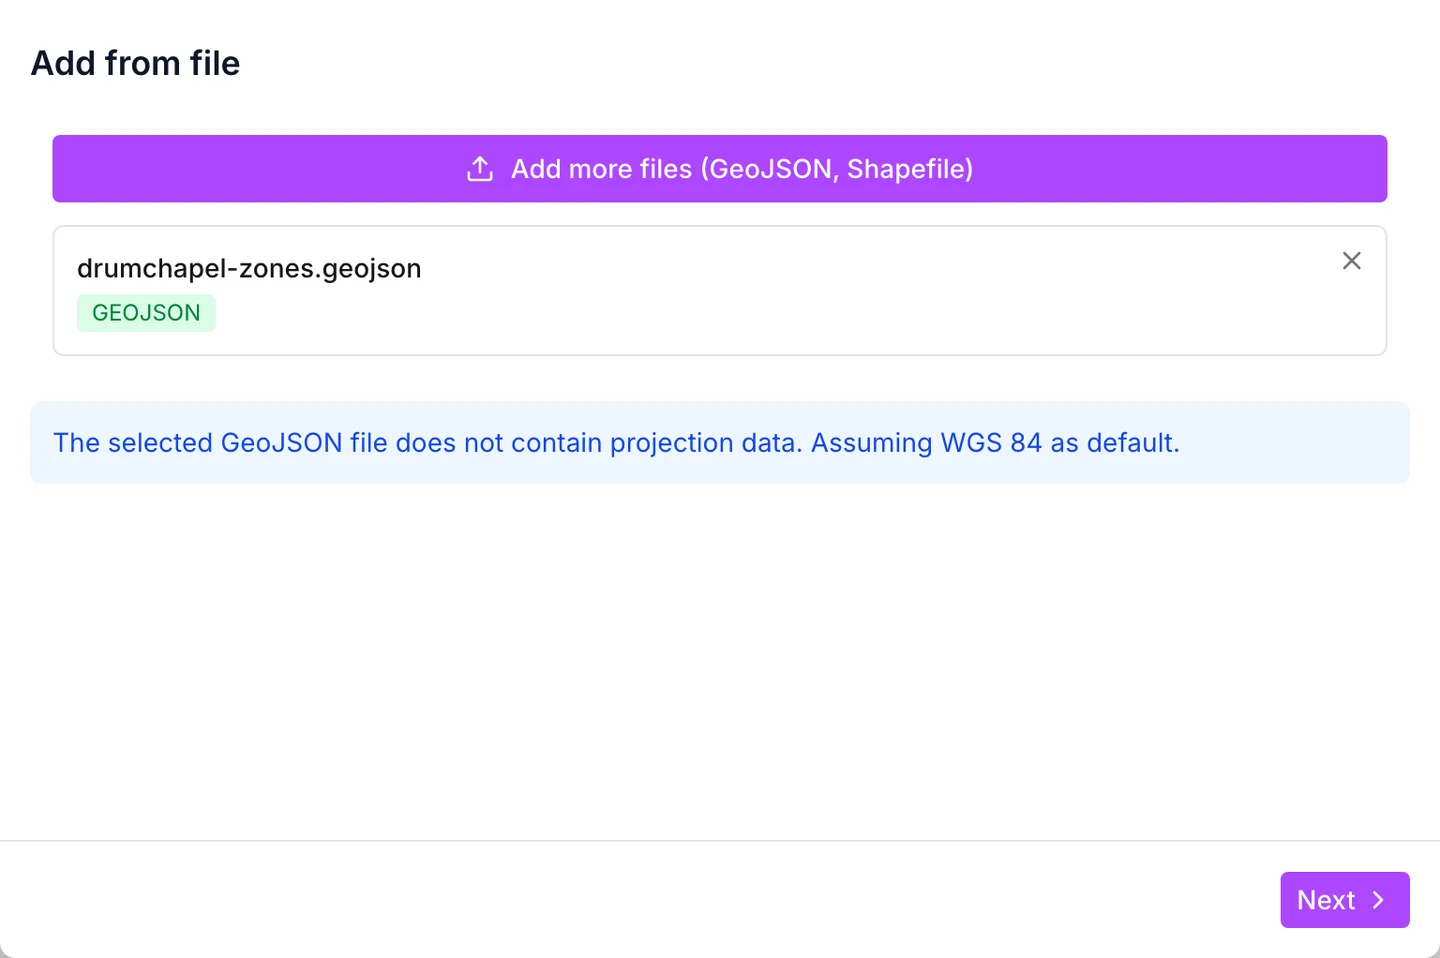
Section titled “Add the file”Drop the file onto Add from file, or click to browse. A Shapefile needs all its parts together. The dropzone names the parts that are still missing. If the file states no coordinate system and its coordinates are longitude and latitude, the app accepts the file. The app reads the coordinates as WGS 84. A note on the step says so: The selected file does not state a coordinate system, so its coordinates were read as longitude and latitude (WGS84). If the coordinates are anything else, the wizard refuses the file with The file contains coordinates that are not in a recognized projection.
-
Choose a label
Section titled “Choose a label”Choose the property that carries the zone name. The preview table under the selector shows the first seven labels and how many more there are. A property that holds serial numbers is thus obvious before you commit to it. None (auto-generate labels) names the zones
Z1,Z2,Z3and so on instead.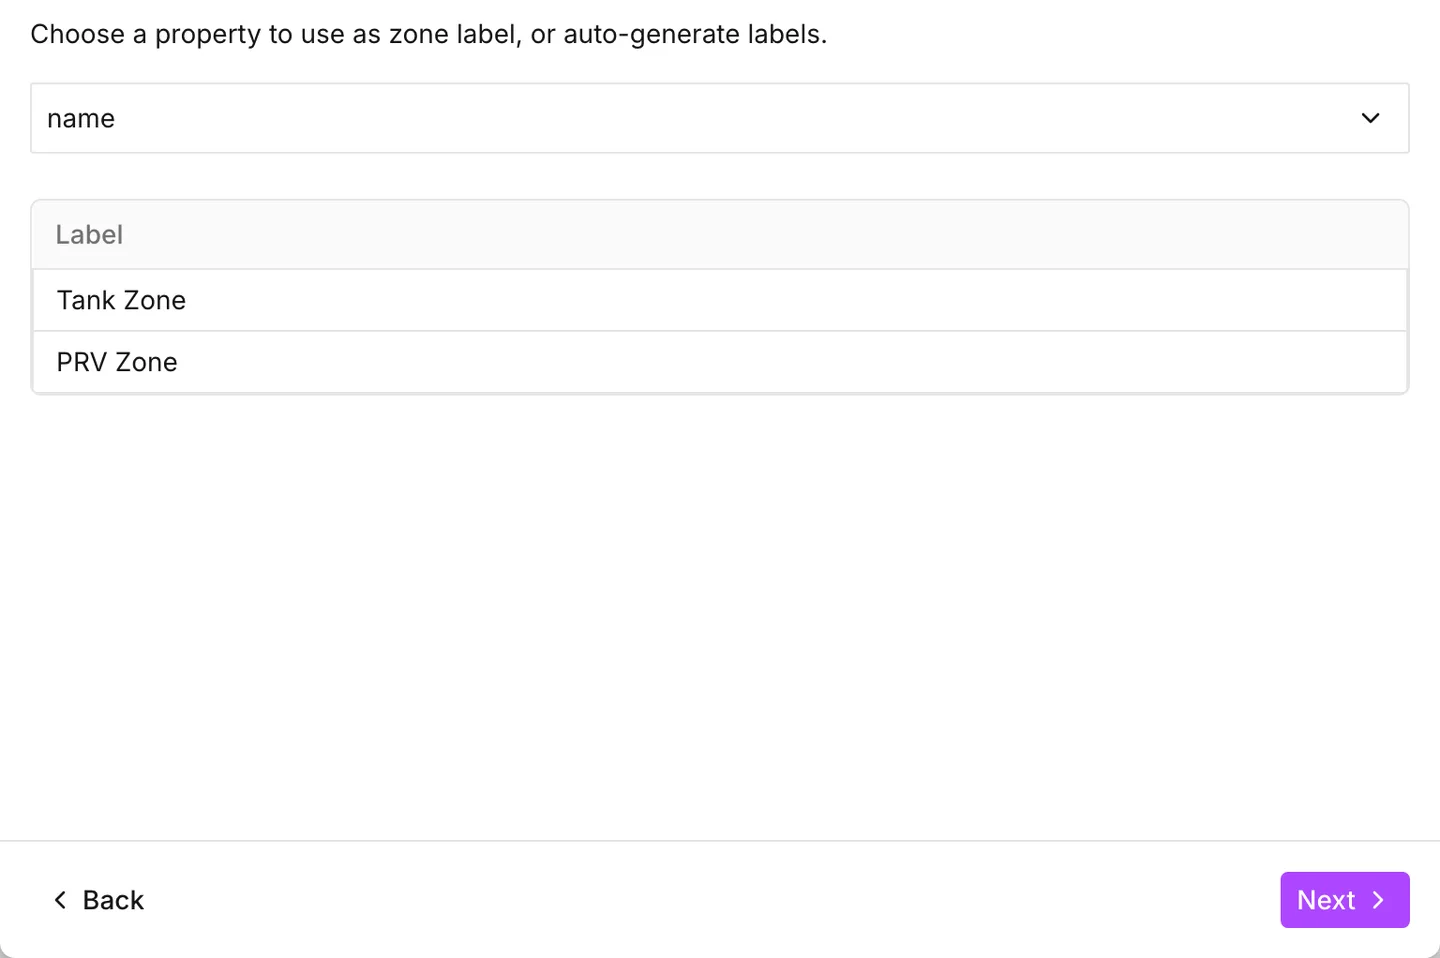
-
Complete
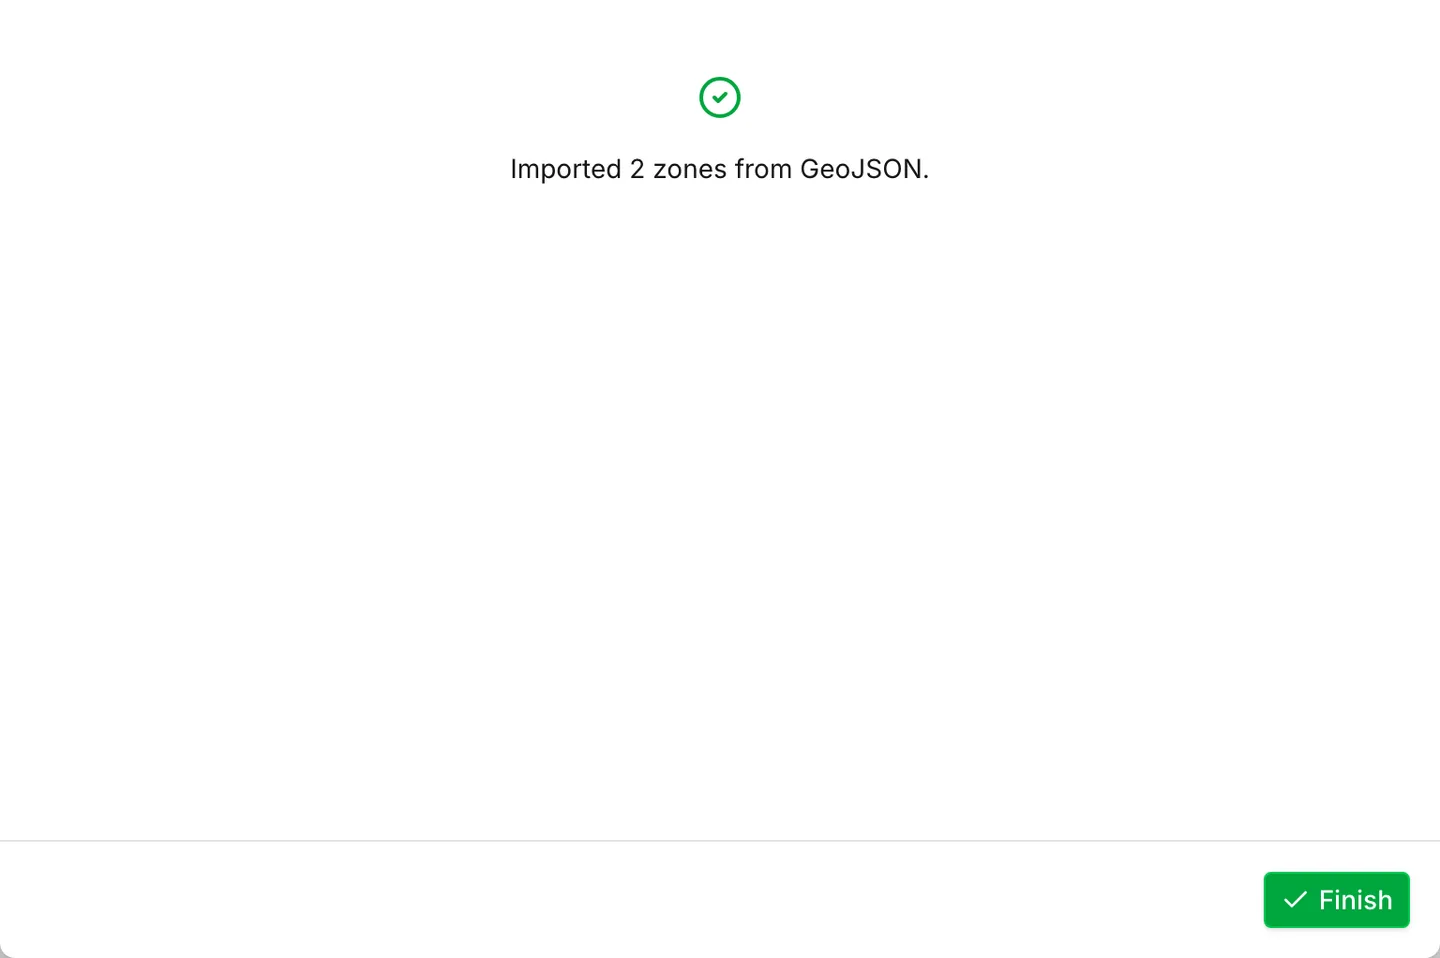
Section titled “Complete”The last step reports how many zones the app imported. It also lists the zones that the app merged.
Merging
Section titled “Merging”When you choose a label property, the app groups every feature with the same value into one zone. A set of eleven polygons that together make up one DMA thus arrives as a single zone.
The Complete step lists each merged label against its Number of merged features. A count that you did not expect is thus visible before you leave the wizard. Auto-generated labels never merge, because each feature becomes its own zone.
The model builder is a second way to import zones. If you assign a polygon layer to Zones during a GIS build, the layer arrives with the model. The app merges its features by label in the same way. See Build a model from GIS.
Zones on the map
Section titled “Zones on the map”When a project has zones, a Zone symbology section appears in the Map tab, above Customer points. Its controls are Visible, Color by, Palette and Label by. See Symbology.
Three things about how the app draws zones are useful to know first:
- The fill is faint, and gets fainter as you zoom in. A zone is a bird’s-eye overlay. At the zoom level for pipe editing it is almost invisible. This is deliberate, because a zone is not something you work over.
- The app gives neighboring zones different colors. When you set Color by to Label, the app finds which zones overlap each other’s extents. It then gives two neighbors colors that are not similar, so a boundary is clear even on a large set.
- Labels are off until you ask for them. Set Label by to Label to write the zone names on the map.
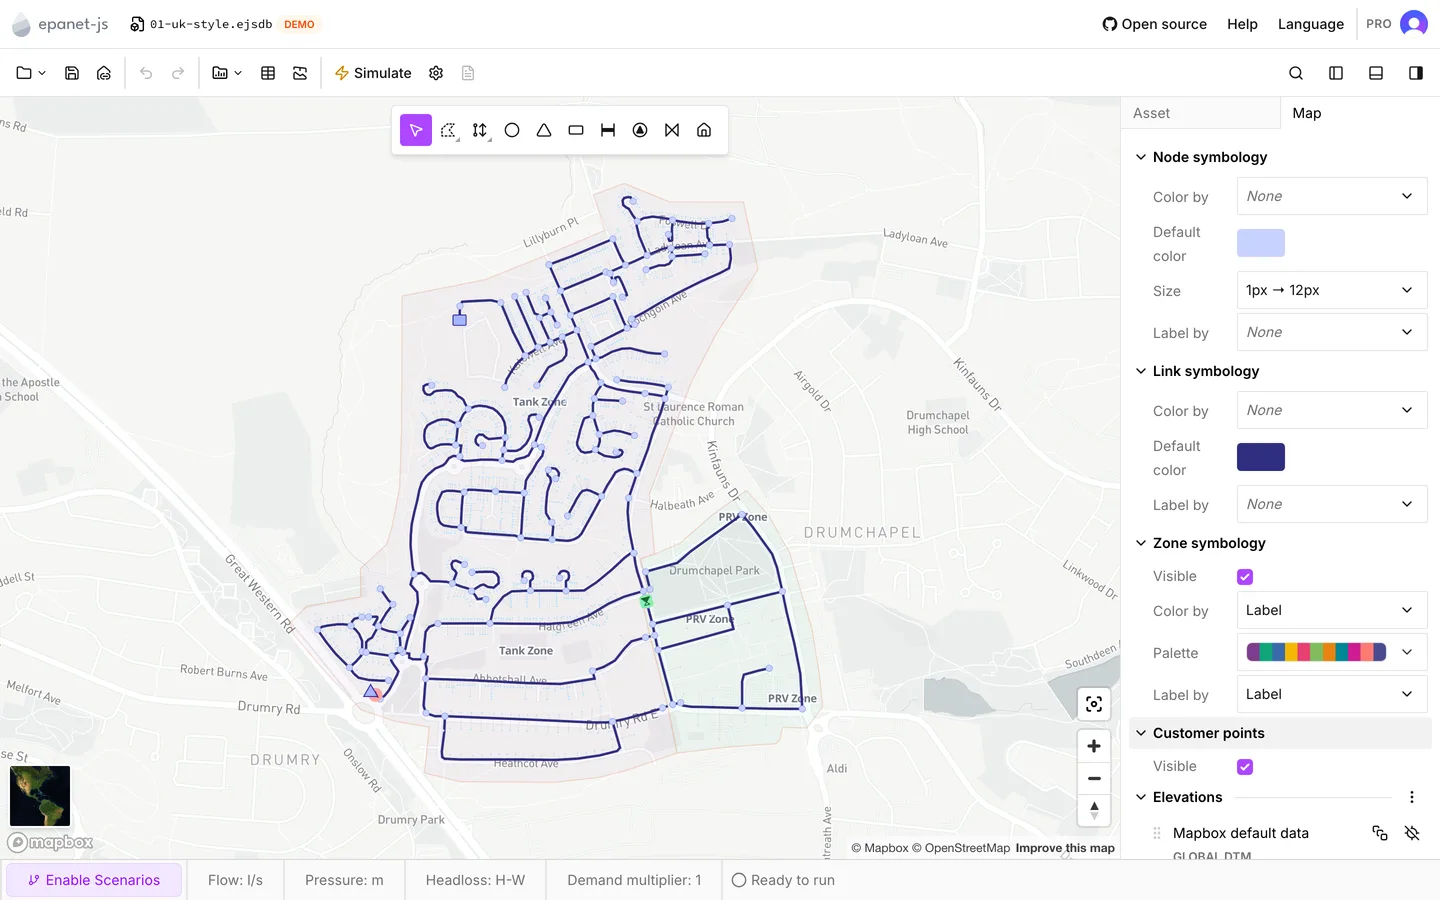
The app draws zones under the network. Clicking a zone does nothing, because you cannot select a zone. A zone is never part of a selection.
Allocating customers by zone
Section titled “Allocating customers by zone”Customer point allocation is the one place where a zone changes what the app does. In Customers allocation, under Scope, the Allocation zone selector lists every zone in the project. It defaults to All zones. When you choose one zone, the run covers only the customer points inside that polygon. Results preview then reports the coverage inside that zone, which is the number of its customers that the rules cover. It reports this coverage over Coverage across network, which counts the customer points in the whole model that are still unallocated.
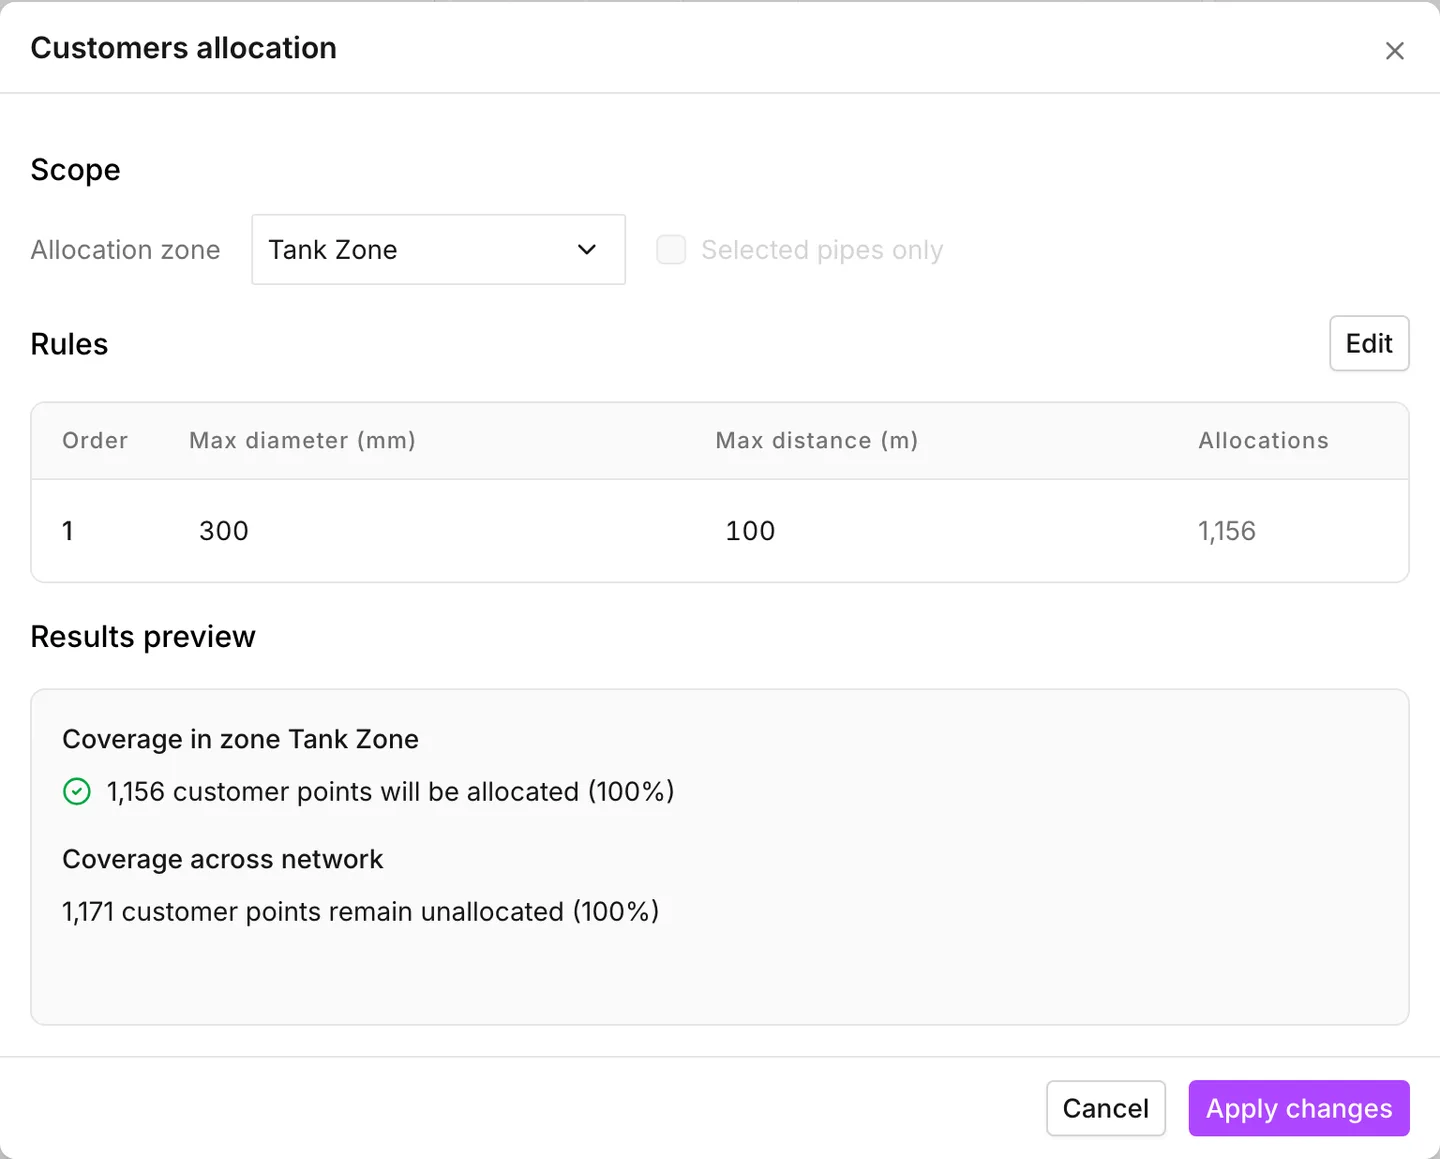
Thus you can do a large allocation one area at a time, and make sure that each area is correct. The other option is one pass over the whole network that you either trust or do not. See Customer points.
What zones are not
Section titled “What zones are not”- No asset carries a zone. A junction does not know which zone it is in. A zone is not a column in the data tables, and not a field on the asset tab. You cannot color the network by zone in Symbology.
- The engine does not read zones. A zone changes no result.
- The app does not write zones to an exported INP, because the format has no
section for them. The app saves zones in the project file. If you want the
zones to travel, use
.ejsdb. See Import and export. - Zones have nothing to do with the boundary trace. Selection trace uses the word “zone” for the hydraulic area around an asset, and it works that area out from the network itself. See Selecting and finding assets.
Saving, undo and scenarios
Section titled “Saving, undo and scenarios”An import of zones changes the project. The unsaved marker appears, and Save
writes the zones into the .ejsdb.
Two things behave differently from a network edit:
- Undo does not take zones back out. The import is not in the undo history. The only way back is to import the previous set again.
- Zones are not part of a scenario. If you import zones while a scenario is active, the app writes them to the project itself. When you switch back to Main, the zones are still there. See Scenario work.
- Symbology — the Zone symbology controls in full.
- Customer points — how to import and allocate the customers that a zone scopes.
- Projections — what to set before the import is available at all.