
Pumps
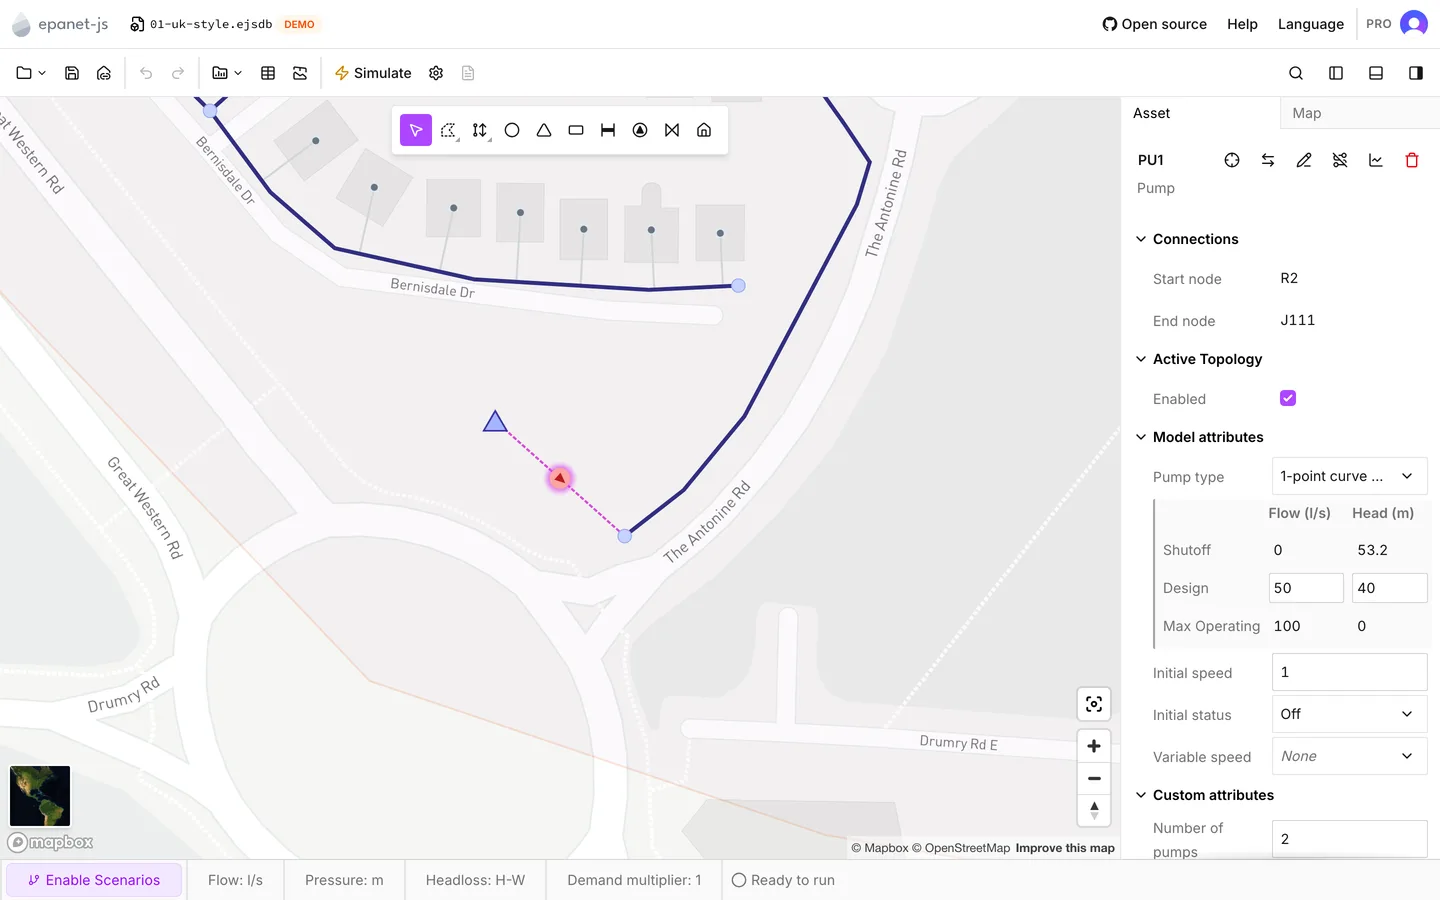
A pump is a link between two nodes. It adds head from its start node to its end node. A pump comes from the Pump tool (6), from the model builder, or from an INP. A pump carries no length, so the app measures nothing on a pump from the line you drew. Only the direction comes from that line, and that direction is the direction water is pumped.
When you select a pump, the side panel opens on the Asset tab. See The Asset tab for the panel. See Drawing and editing for drawing, Redraw and Reverse.
Connections
Section titled “Connections”Start node and End node are read-only. Their order is the pumping direction, because the pump adds head from the start node towards the end node. A pump drawn the wrong way round pumps the wrong way. Reverse in the panel header swaps the two nodes, and R does the same.
Pump type
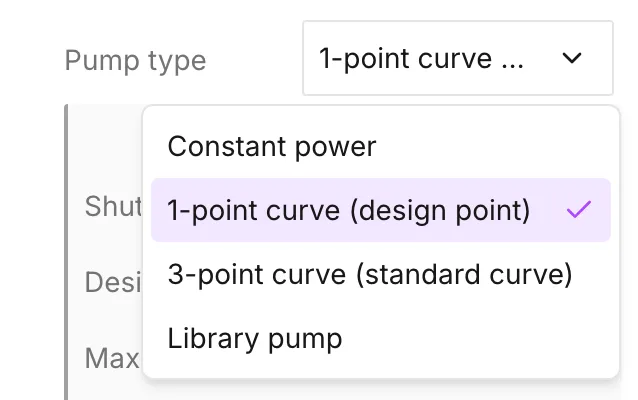
Section titled “Pump type”Pump type is the first row of Model attributes, and it decides which fields the section shows under it. There are four types.
| Pump type | What it asks for |
|---|---|
| Constant power | One Power field, in kW or hp |
| 1-point curve (design point) | One design point: a flow and a head |
| 3-point curve (standard curve) | Three points: Shutoff, Design, Max Operating |
| Library pump | A Pump name, chosen from the curves in the pump library |
A pump you draw arrives as a 1-point curve (design point) with an empty point. That point is the first thing to fill in on a new pump.
Constant power
Section titled “Constant power”Power is the pump’s power, in the project’s power unit (kW or hp). This value must be positive. The app reports an empty field as Pump power missing. It reports a zero or negative value as Pump power must be positive. This is the only pump type with no curve behind it. See the EPANET 2.2 manual for what a constant-power pump does in a run.
The two curve types
Section titled “The two curve types”Both types show the same table of three rows. The table shows Flow and Head in the project’s units, and the rows are labeled Shutoff, Design and Max Operating.
- On a 1-point curve (design point), you can type only the design row. The app works the other two rows out from it and shows them read-only. Shutoff head is 1.33 times the design head, at zero flow. Maximum operating flow is twice the design flow, at zero head. When you change the design point, the other two rows move with it.
- On a 3-point curve (standard curve), you type all three rows. The one exception is the shutoff flow, which is fixed at zero. Flows must ascend down the table and heads must descend.
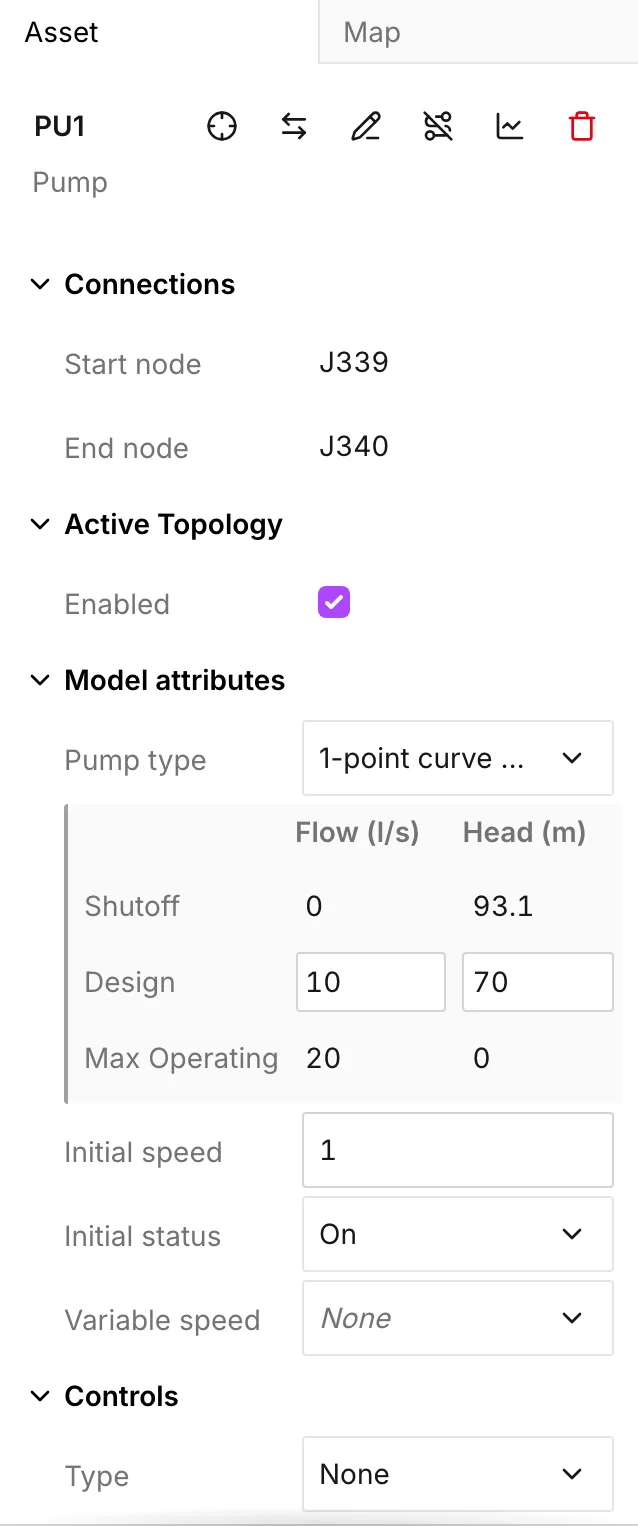
A change from one type to the other keeps the design point. From one point to three, the app writes the two derived rows in as real values, and you can then edit them. From three points to one, the app drops those rows and keeps the middle row.
As you type, the panel shows what is wrong with the curve under the table. The messages name a missing value, a flow of zero, flows that are not in ascending order, and heads that are not in descending order. The Model attributes check reports the same problems as Pump curve missing and Pump curve points are invalid. See Network review.
Library pump
Section titled “Library pump”Library pump points the pump at a curve in the project’s pump library. The pump then has no points of its own. You choose the curve under Pump name. You can also press Open library… to add or edit curves without leaving the panel. A read-only Curve type row under it names the shape of the chosen curve: 1-point curve (design point), 3-point curve (standard curve) or Multi-point curve. This row is the only way to tell from here how many points are behind the curve.
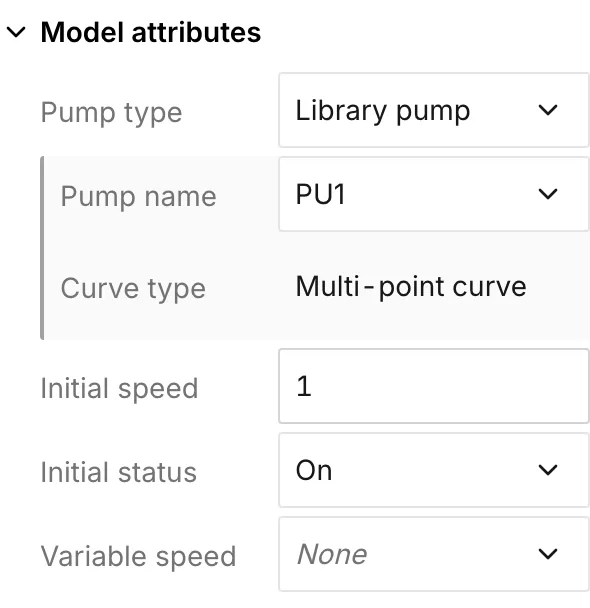
Several pumps can share one curve. When you edit that curve, all of them move. This is the reason to use the library. You do not have to type the same three points into every pump of a type. See Pump library.
Speed and status
Section titled “Speed and status”Initial speed is the pump’s relative speed, and it carries no unit. An empty field means 1. The app reports a negative value as Pump speed must be zero or greater. See the EPANET 2.2 manual for what a relative speed does to a curve.
Initial status is On or Off. An Off pump stays in the model. The map draws it with a dashed line and its own icon, and the exported INP holds it as a closed link. A speed of zero has the same effect on the run as Off.
After a run, the icon and the dashes follow the run. The map then shows the status that the pump ended the timestep in, not the status you set. The panel keeps the two apart. Initial status is what you set, and Status under Simulation results is what the engine did with it.
Variable speed sits under the status, and it takes None or Pattern based. When you choose Pattern based, a Speed pattern selector appears. It takes a pump-speed pattern from the patterns library, and the app applies the multipliers to the initial speed across the run. Open patterns… opens the library on the pump-speed section. See Patterns.
Controls
Section titled “Controls”The Controls section switches this pump during the run. Type takes:
- None — the pump holds its initial status and speed for the whole run.
- Level-based — a Tank, an on level and an off level, with a speed for each. When the model has no tanks, this option is unavailable.
- Time-based — a table of steps, each with a Time, a Status and a Speed. You build the table with Add time step.
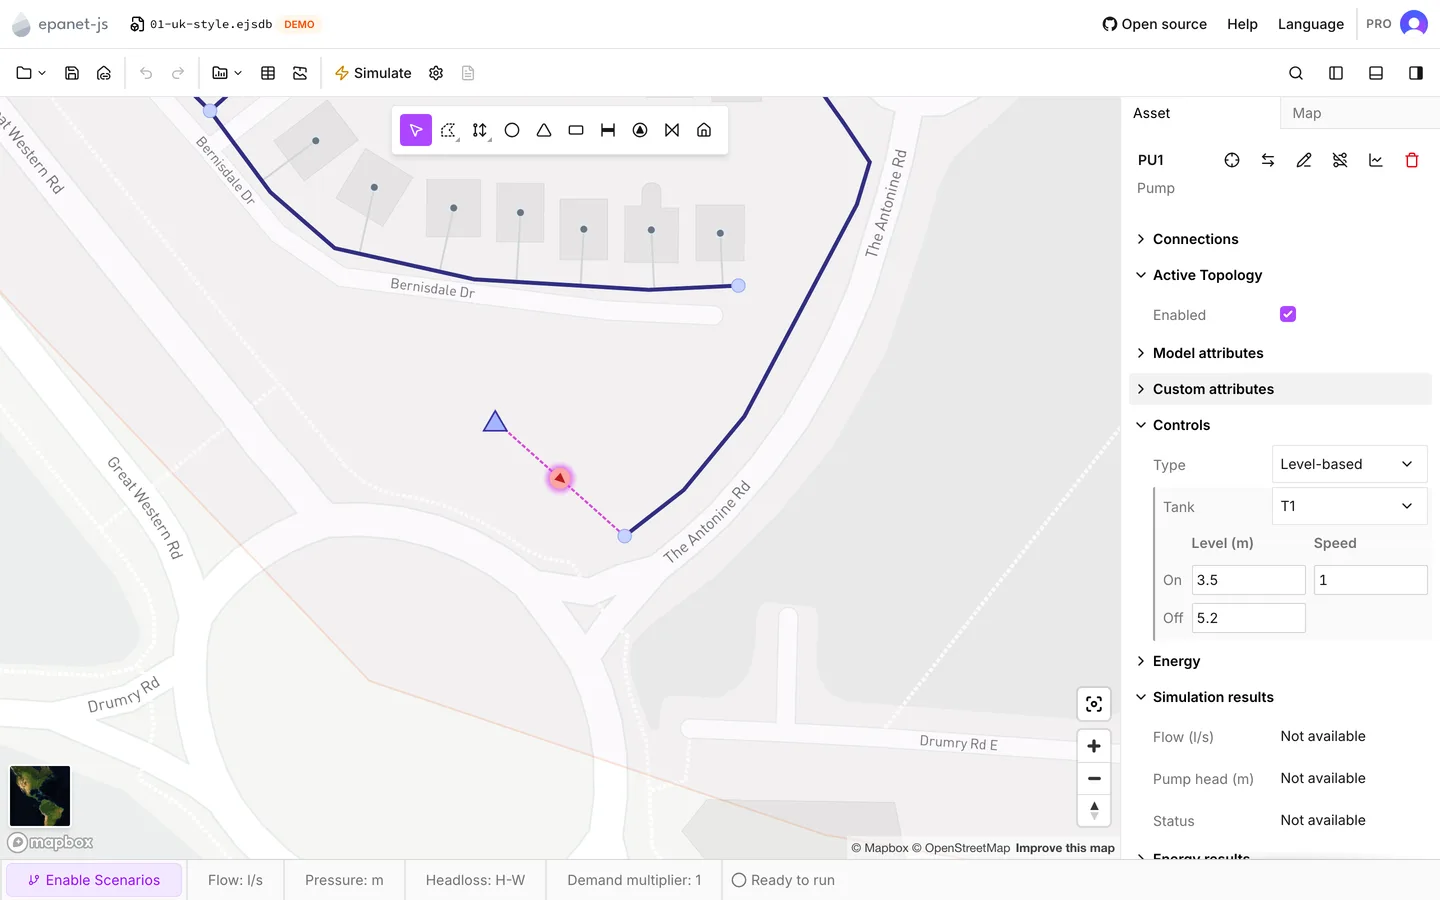
Native controls are a paid feature, except on the demo networks. On the free plan, a choice other than None opens Priority access instead. If the project also has raw control statements that name this pump, the section shows Legacy EPANET controls detected. That message opens the Legacy EPANET controls dialog. When you configure the same pump in both places, the controls fight each other. See Controls.
Energy
Section titled “Energy”The Energy section is what a pump contributes to the energy report. Every row is optional, and each one falls back to the project-wide value. The app shows that value as the placeholder.
- Efficiency curve — an efficiency curve from the pump library. When you choose none, the selector names the project-wide efficiency instead, which starts at 75%.
- Energy price — the energy price for this pump. It carries no unit. An empty field means the project-wide price, which starts at 0. The app reports a negative value as Pump energy price must be zero or greater.
- Price pattern — a price pattern for this pump. Where the project has a pattern, the empty option names it. Where the project has none, the empty option reads Constant. The list leaves the project-wide pattern out, because the empty option already means it.
The project-wide values, and the demand charge that goes with them, are in Simulation settings. See Energy.
Simulation results
Section titled “Simulation results”| Row | What it is |
|---|---|
| Flow | Flow through the pump at this timestep |
| Pump head | Head added by the pump at this timestep |
| Status | On or Off, as the run left it |
Water age, Water trace and Chemical join them when the run produced them. Every row follows the timestep that the time browser shows. See Reading results.
Status carries the engine’s warning where there is one. The row can then read Off - Cannot deliver head or On - Exceeds maximum flow. Both mean that the operating point asked of the pump is off the end of its curve. Both are worth a look before you trust the flows around the pump.
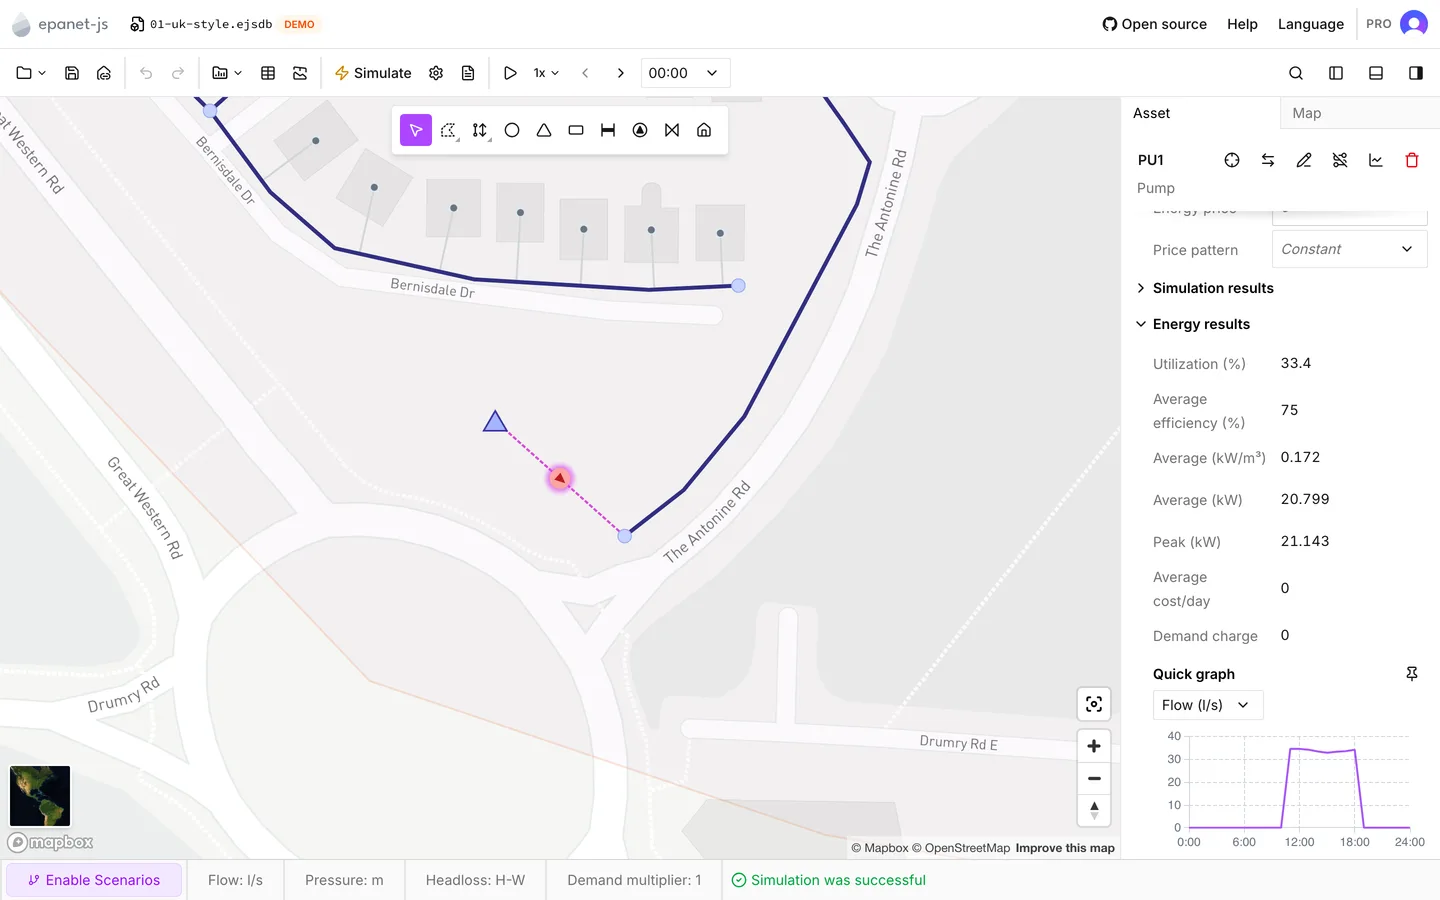
A second section, Energy results, holds the figures for the whole run instead of the timestep:
- Utilization and Average efficiency, as percentages.
- An Average in kW per unit flow.
- An Average and a Peak power.
- Average cost/day and Demand charge.
These rows do not follow the time browser.
What reaches the run
Section titled “What reaches the run”For each pump that is enabled, the model writes its two nodes and its
definition. The definition is POWER for a constant-power pump, or HEAD with
a curve name for the other three types. The model also writes the speed and the
speed pattern where the pump has them.
The model writes the initial status too. When the initial speed of a pump is neither 0 nor 1, the model writes that speed as the status setting. The model writes the Energy rows only where the pump sets one. Disabled pumps are left out of the run and out of an exported INP.
Working on many pumps
Section titled “Working on many pumps”- When you select several pumps, the multi-asset panel sets Enabled, Initial status, Initial speed, Speed pattern, Efficiency curve, Energy price and Price pattern across the whole selection. Pump type and the curve behind it are not on that list. You set those one pump at a time, or in the data table.
- The Pumps tab of the data tables adds Pump type and Library curve to that list, next to Power. The tab also sorts, and it accepts a paste down a column. Its Pump type column offers only Constant power and Library pump. It shows the two typed curves, but you cannot choose them there, because a grid has nowhere to type their points. You can edit Power only on a Constant power row, and Library curve only on a Library pump row.
- Graphs plots Flow, Pump head, Relative speed or Status at one pump across the whole run.
- Pump library — head and efficiency curves that pumps share.
- Controls — switching pumps during a run.
- Energy — what the energy figures are built from.
- Valves — the other link with a setting.