
Quick start
This is the shortest route from an empty browser tab to a set of results that you can read. It uses one of the two demo networks that come with the app. You need no model, no account and no files of your own.
To start with your own work instead, go to Open an existing model or Build a model.
-
Open the app
Section titled “Open the app”Go to app.epanetjs.com. The welcome dialog opens when the app starts.
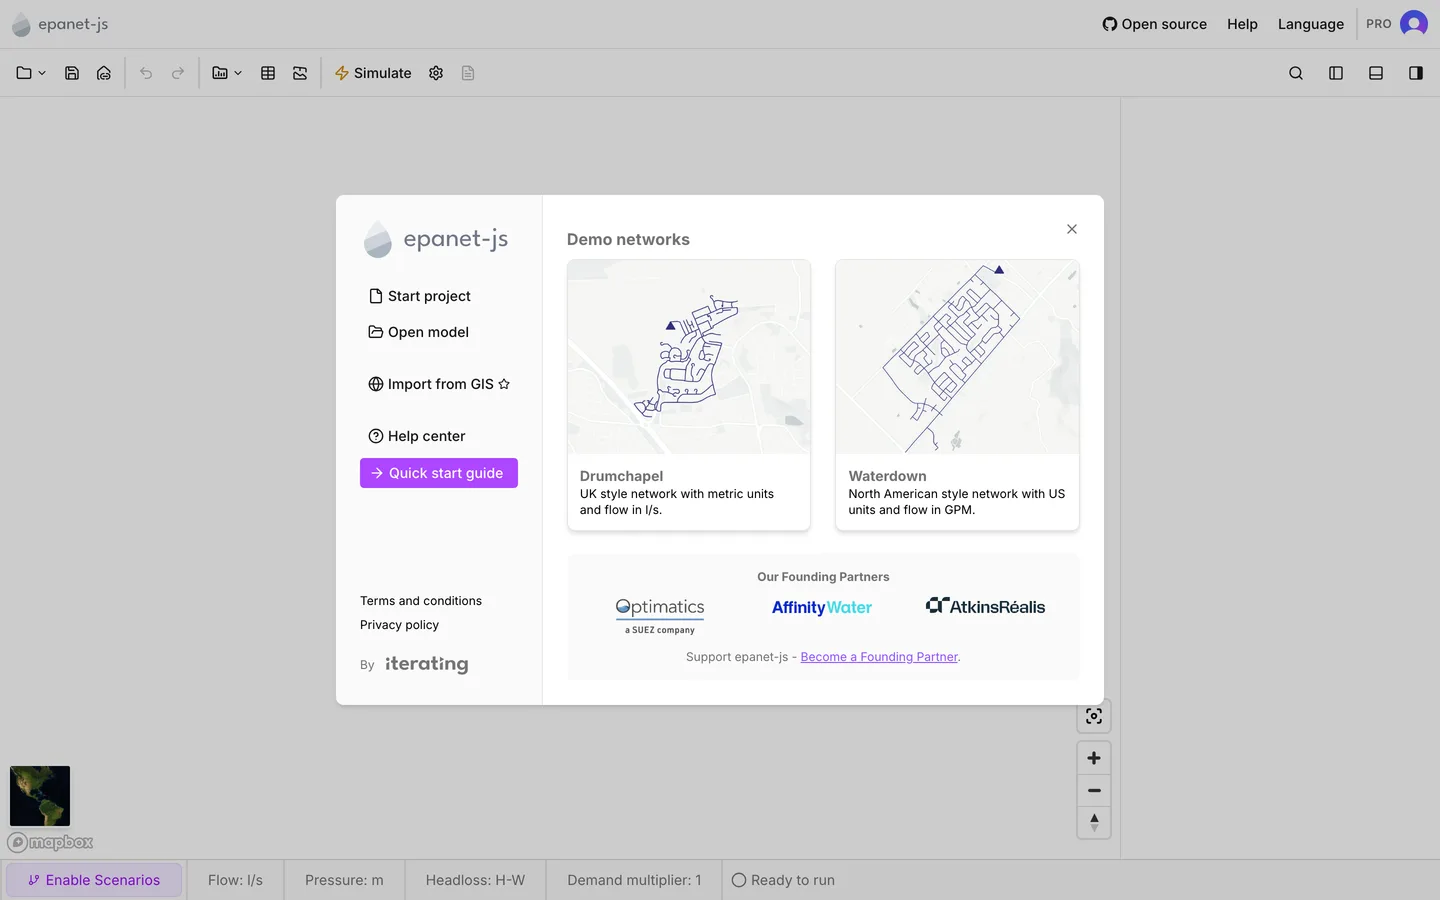
Down the left are the three ways into a project:
- Start project for an empty project
- Open model for a file you already have
- Import from GIS for the model builder
The left side also holds links to this help center and the Quick start guide.
The right side holds the demo networks. On a Chromium browser, that side changes after you open or save something. It becomes Recent projects, and the demos move in among your own files as cards badged Demo. Otherwise it is headed Demo networks.
You can open this dialog again at any time. Use Help > Welcome page, or click the epanet-js logo in the menu bar.
-
Open a demo network
Section titled “Open a demo network”Click one of the two cards.
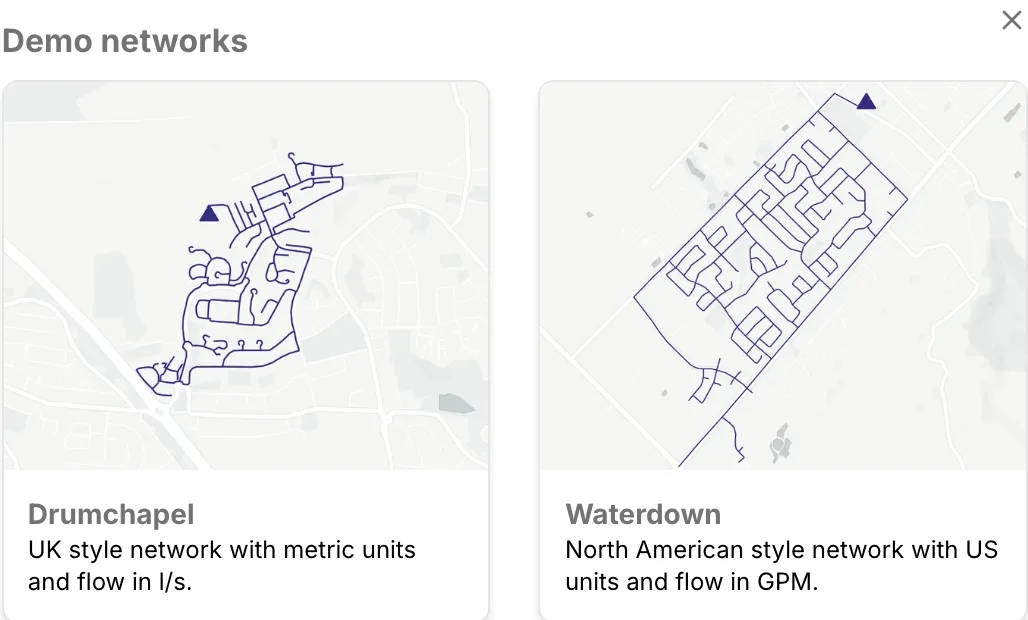
Both are complete models. Your choice only decides the unit system of the results:
- Drumchapel is a UK-style network in metric units, with flow in l/s and pressure in m. It has 136 junctions, 154 pipes, a pump, a valve, a tank, a reservoir, two zones and about 1,200 customer points.
- Waterdown is a North American network in US units, with flow in GPM and pressure in psi. It has 129 junctions, 168 pipes, a valve, a tank, two reservoirs, one zone and about 2,000 customer points.
Either network is fine for this walkthrough. The network draws on the map. The status bar at the bottom of the window then fills in:
- Flow, Pressure and Headloss show the project’s units and headloss formula.
- Demand multiplier shows the global multiplier.
- The right-hand end reads Ready to run.

-
Find one asset
Section titled “Find one asset”Press Ctrl+K (⌘+K on macOS) to open Search assets…. Type an asset label and press Enter. The map moves to that asset and selects it. You can also click an asset on the map. This does the same thing without the typing.
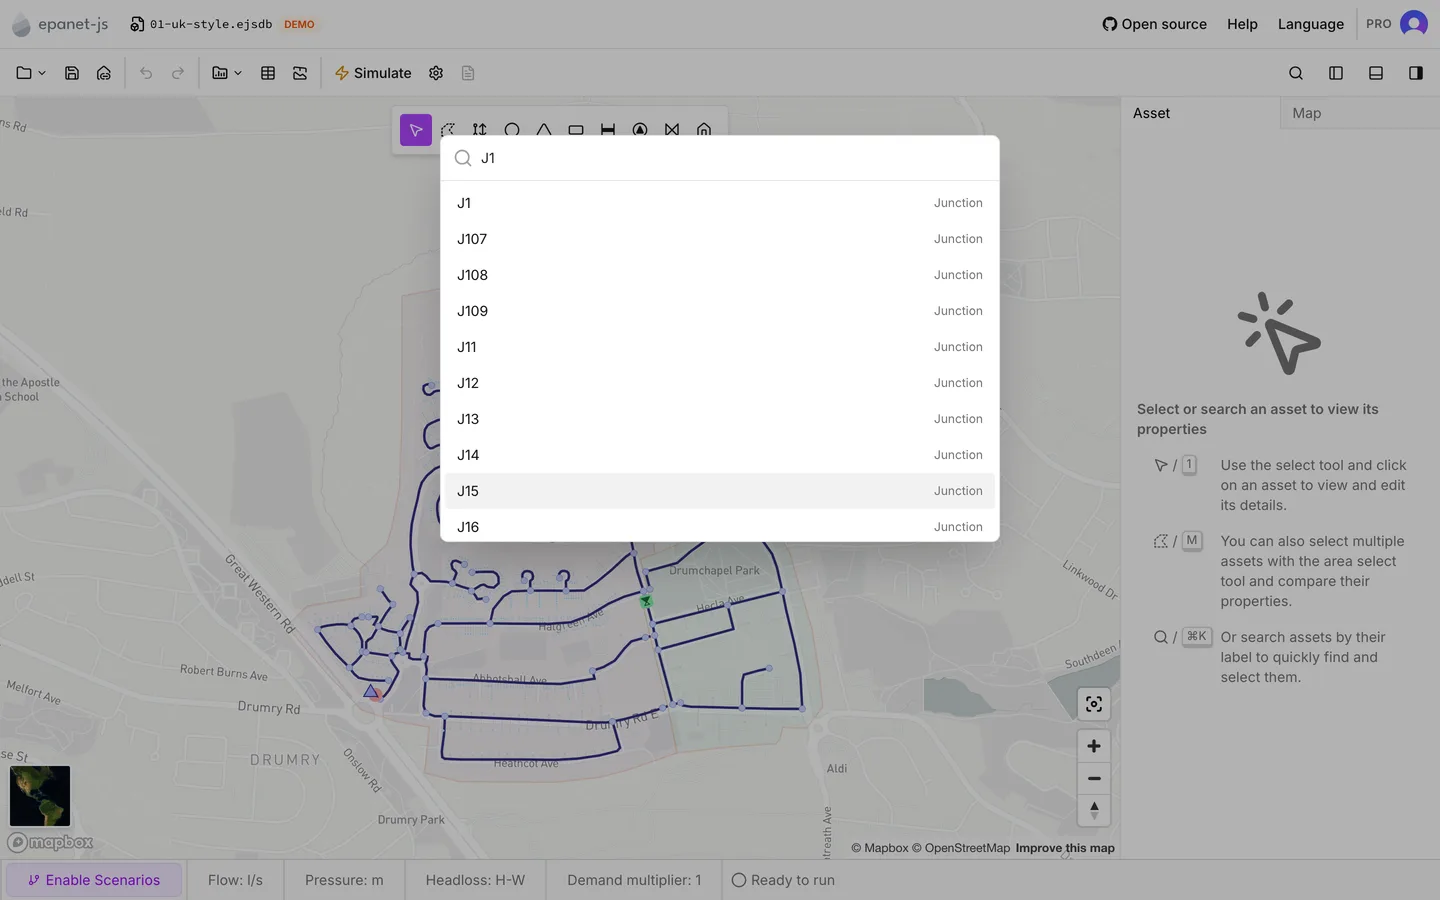
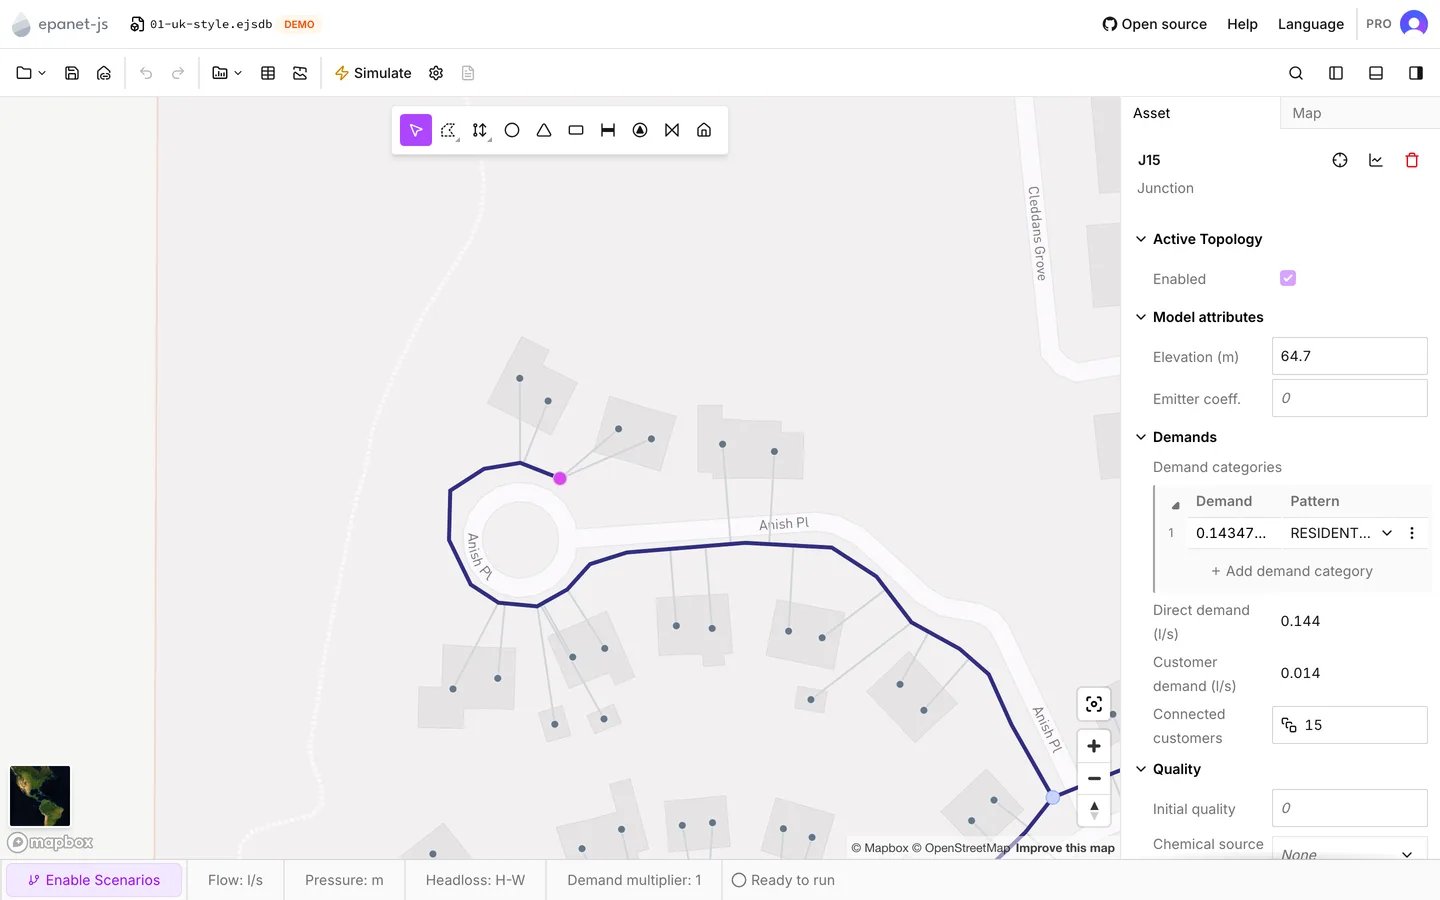
The panel on the right is now on its Asset tab. The tab shows the properties of that asset. When you edit these properties, you change the model. See The asset tab for what each section holds.
-
Run the model
Section titled “Run the model”Press Simulate in the toolbar, or Shift+Enter.
Some problems make the results meaningless: missing attributes, orphan assets, or a sub-network with nothing supplying it. If the model has these problems, a Before running the simulation dialog appears first. The dialog offers Review issues and Run anyway. Otherwise the run starts immediately, and a progress dialog appears with Stop simulation.
A clean run ends on Simulation was successful. Press OK to close the dialog, or View report to read the report text from EPANET. A run that ends on Simulation with warnings or Simulation with errors offers View report first, because the report gives the reason.
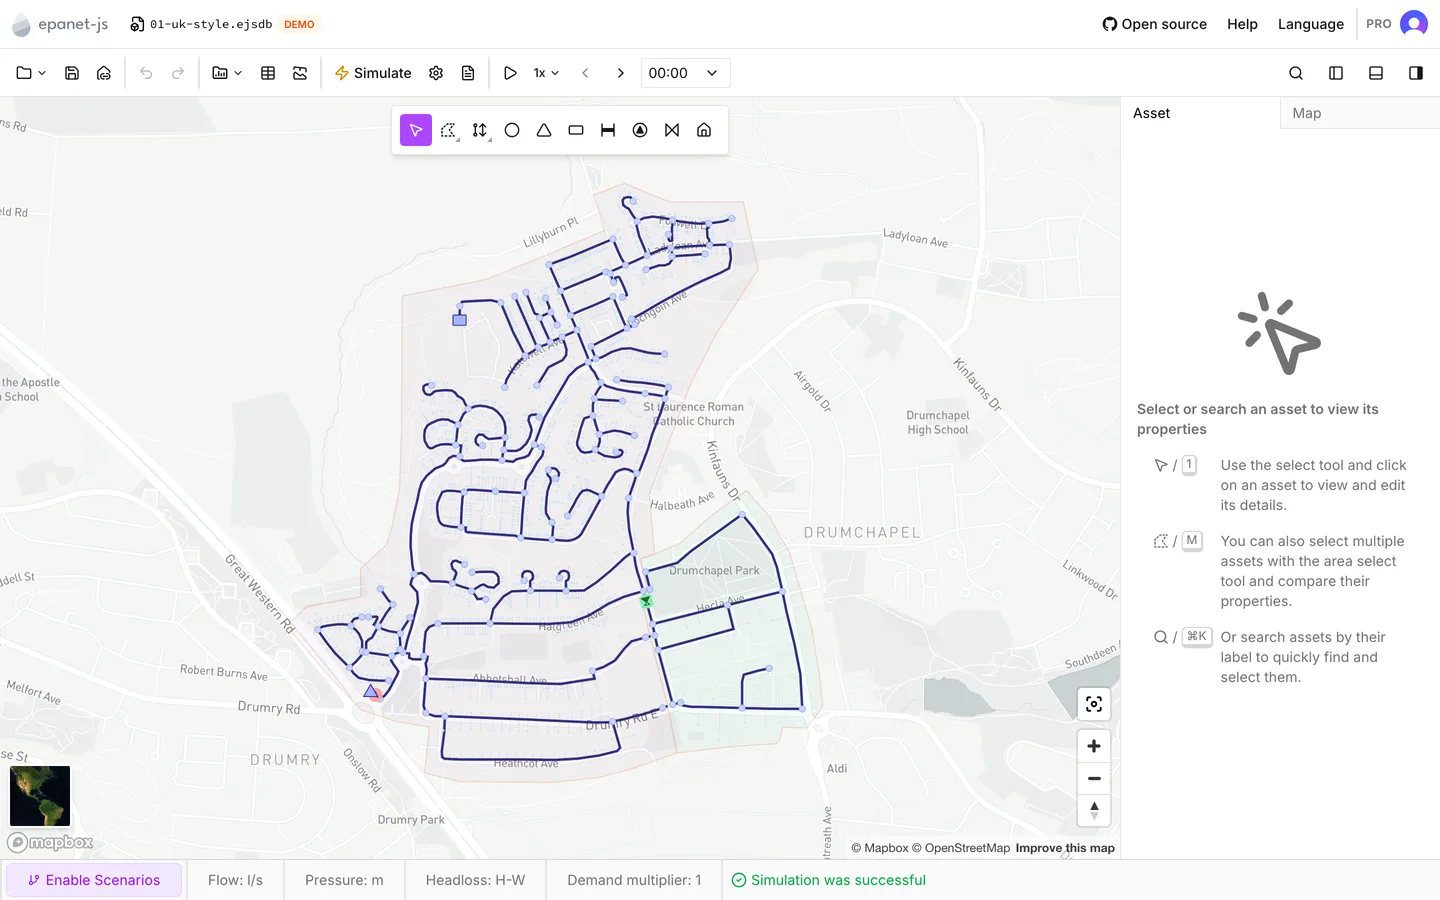
The status bar now shows the outcome of the run. If you then edit anything, it changes to Simulation outdated. This message reminds you that what the map shows no longer matches the model.
-
Color the map by a result
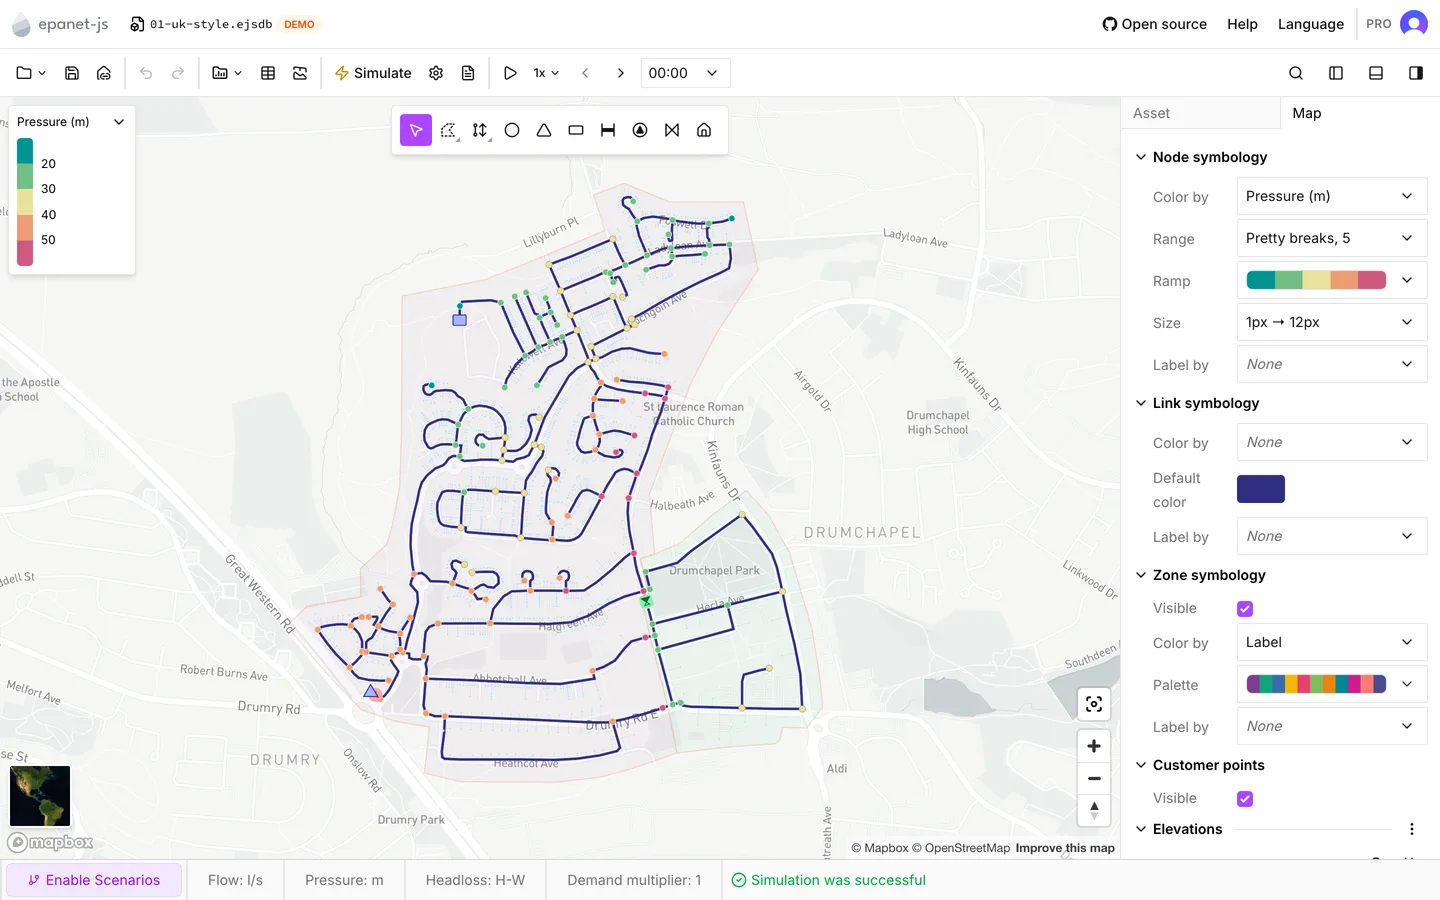
Section titled “Color the map by a result”The app does not color the map with the results automatically.
Open the Map tab in the side panel. Find Node symbology and set Color by to a result such as pressure. Do the same under Link symbology for flow or velocity. See Symbology for the ranges, ramps and labels.
-
Step through time
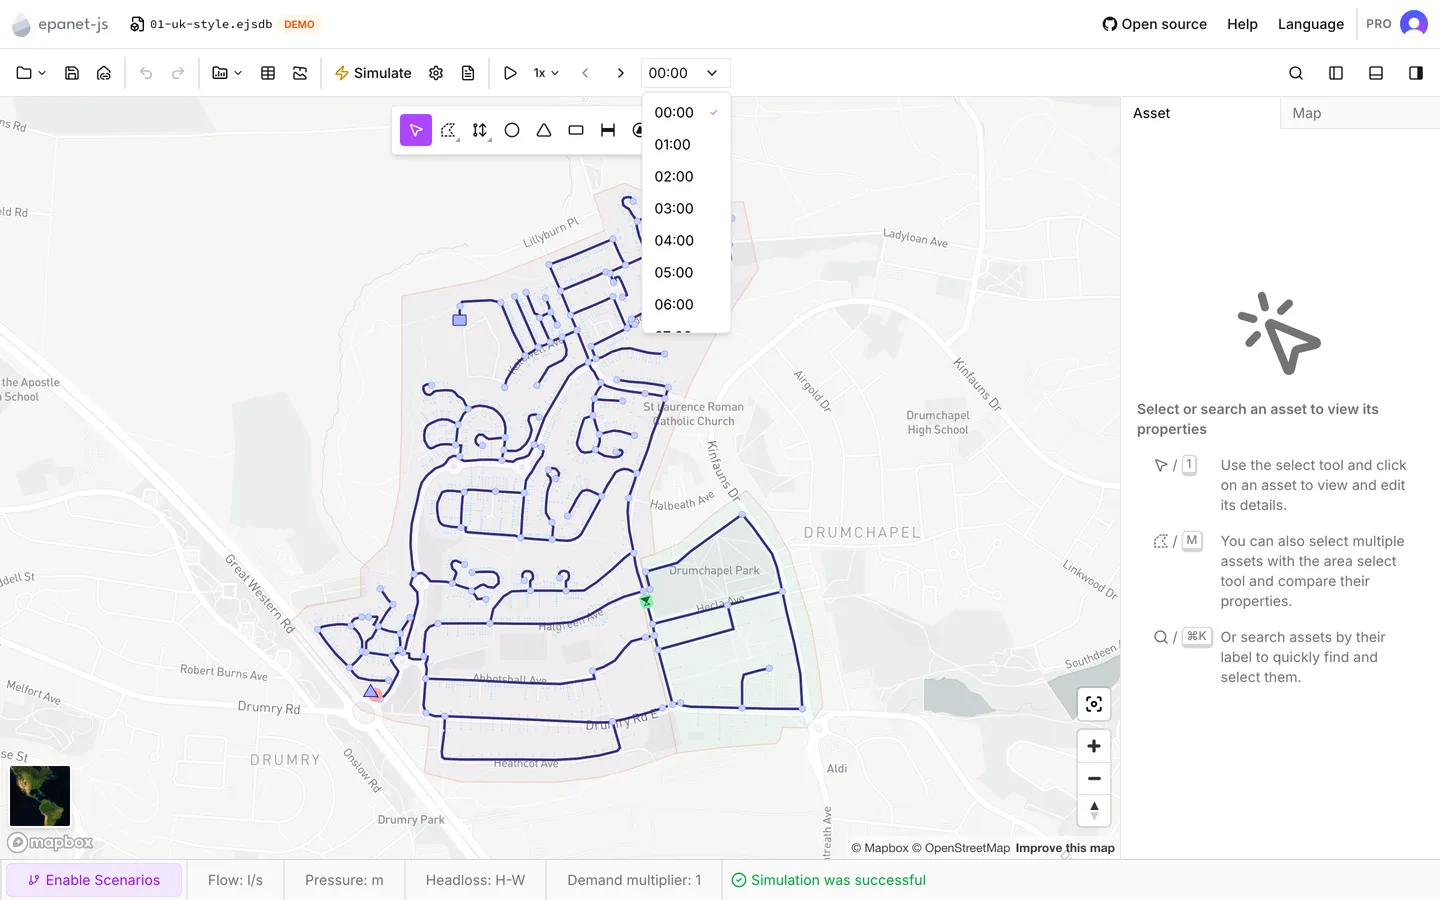
Section titled “Step through time”Both demo networks are 24-hour extended-period runs, reported hourly. As a result, the time browser appears in the toolbar, to the right of the simulation buttons.
Press Previous timestep and Next timestep (Shift+← and Shift+→) to move one step at a time. Press Play simulation (Shift+Space) to animate the run. The map redraws at each step, so the result you colored by animates with it.
When you select one asset, the graph at the foot of the Asset tab plots one of its properties over the whole run. When you click a point on that graph, the app moves the run to that time. See Graphs and Reading results.
-
Keep it, or start again
Section titled “Keep it, or start again”Save writes the project to a file that you choose, as an
.ejsdbproject file. To hand the model to EPANET or to another tool, use File > Export instead — see Import and export.To start again, open Help > Welcome page and choose the other demo network.
- The interface — the rest of the window: menus, toolbar, panels and status bar.
- Selection and search — how to select more than one asset, area selection and traces.
- Running a simulation and Simulation settings — the pre-run checks, the run itself, and the EPANET options behind it.
- FAQ — accounts, plans, browsers and where your data lives.