
Projections
Every project carries one coordinate system, and that system decides more than where the app draws the network. The projection does four things:
- It puts a background map under the pipes.
- It makes it possible to look up elevations from the terrain.
- It sets what a zone file or a customer point file must agree with.
- It sets the numbers that come back out of an export.
Internally the app holds every coordinate in longitude and latitude. It converts
on an import, and it converts back on an export. The system it converts to and
from is the project’s projection. The app stores that projection in the
.ejsdb file with the model. See Projects.
There are two kinds of project:
- A projected project sits on the ground. Its coordinates are longitude and latitude, or a named coordinate reference system with an EPSG code (a national grid, a UTM zone, a state plane). Base maps, satellite imagery, terrain elevations, zone polygons and customer point files all line up with it.
- An X-Y grid project has coordinates but no position. The numbers are a local grid, for example a schematic, a textbook example or a test network. The map draws a grid under them instead of a base map. There is no ground under the network, so everything that needs a real-world location is unavailable.
Where the choice is made
Section titled “Where the choice is made”| Where | What you are asked |
|---|---|
| New project | Two cards, Map-based or Simple X-Y Grid — see Projects |
| An INP import | When the app cannot read the file’s coordinates as longitude and latitude, the Network projection dialog opens — see Bring in an existing model |
| Map tab > Projection | How to change it later — see Changing the projection later |
A model built from GIS data is a fourth case. The builder reads the projection
from the files themselves. It reads the .prj of a Shapefile, a CRS in a
GeoJSON, or the coordinate system that a DXF declares. If the builder cannot
read a projection from a file, it asks you for that file alone. See
Build a model from GIS.
The Network projection dialog
Section titled “The Network projection dialog”Network projection is one screen. It has a search column on the left, a preview map on the right, and two actions in the footer. It opens on an empty state that shows Find your projection. The cursor is already in the search box.
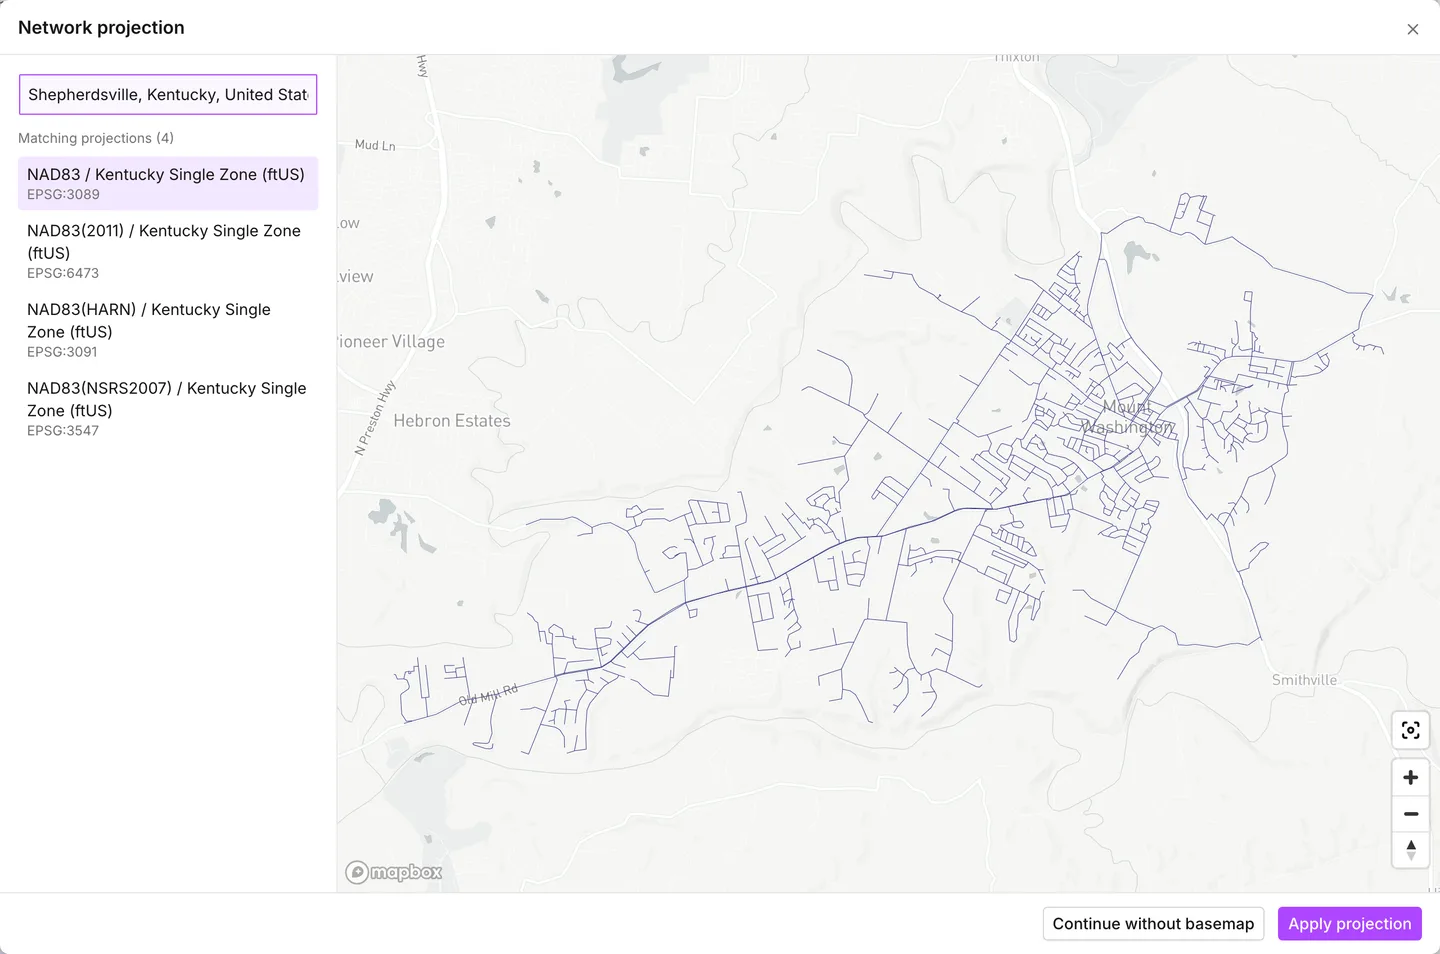
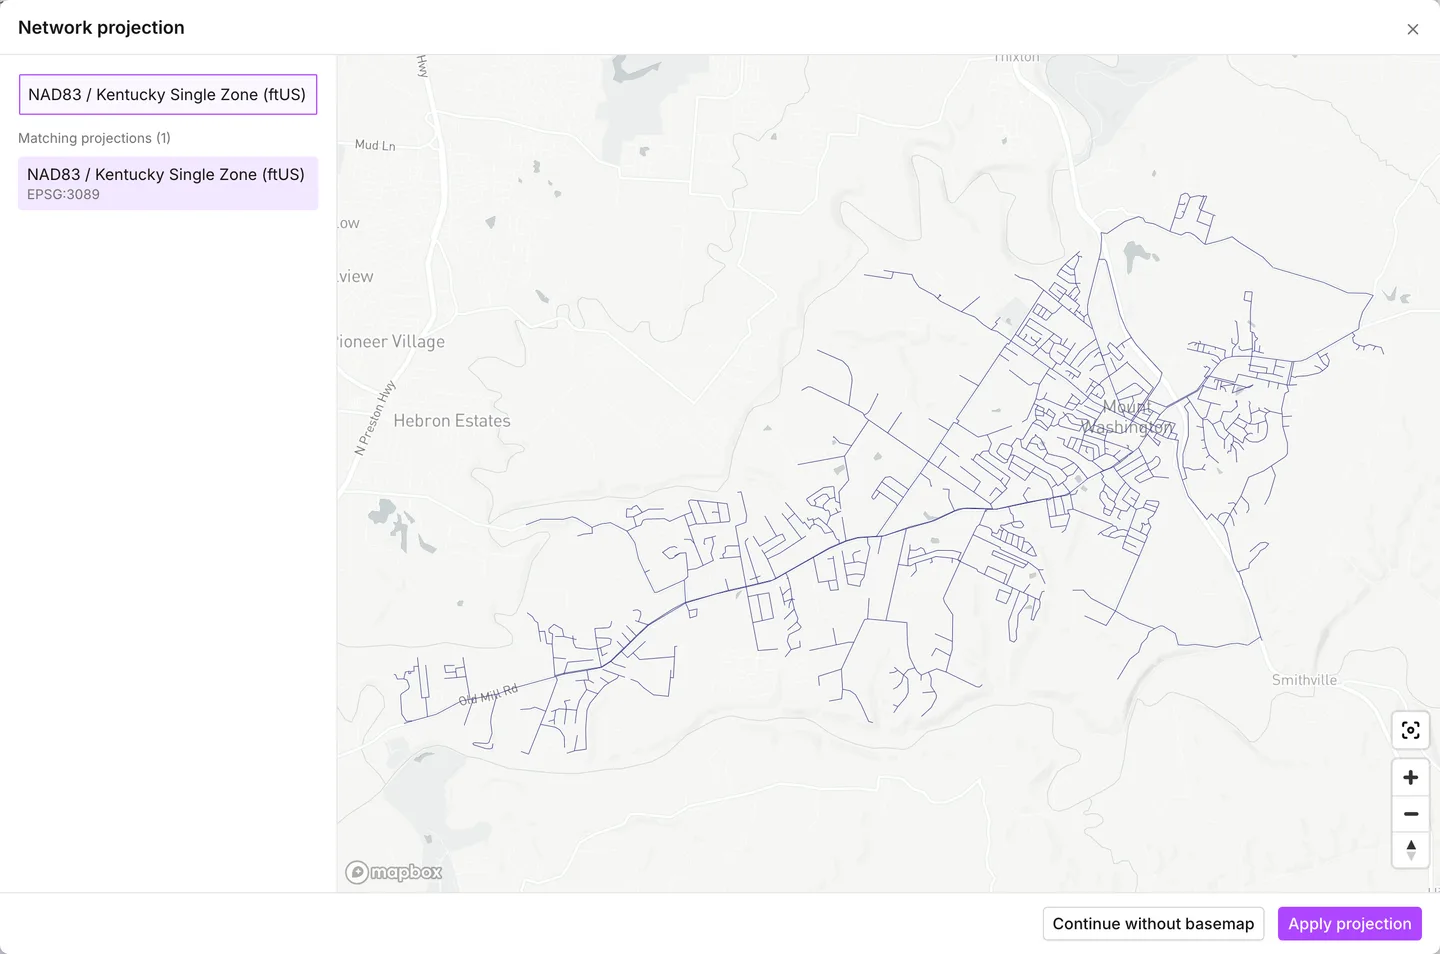
Both frames on this page show the same file, a distribution network in Kentucky. Its coordinates are US survey feet on the Kentucky Single Zone. One frame was taken by place name, the other by EPSG code. Bring in an existing model walks it both ways.
Finding a projection
Section titled “Finding a projection”-
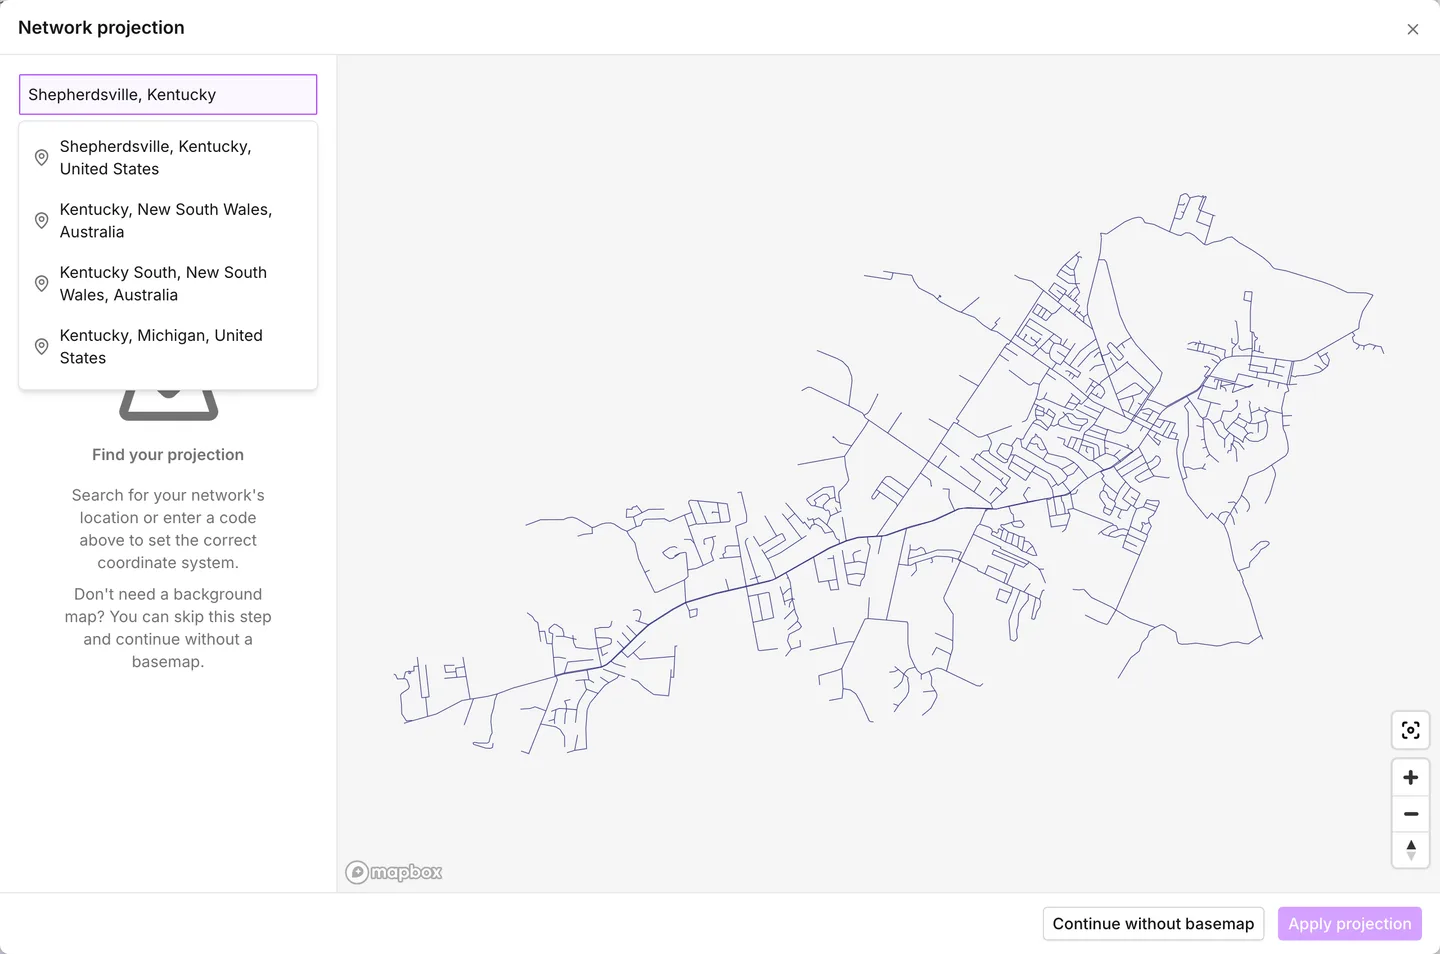
Type into Search by location or code. Two characters are enough to search.
The results mix two kinds of entry. Place names come from a geocoder, and a pin marks each one. The app matches coordinate systems against their name and their EPSG code. It shows up to five of them, with the closest match first. If you type a full code or a full system name, the app skips the place search and shows that system alone.
-
Choose a place. The preview flies to it, and the left column fills with Matching projections and a count.
That list is the useful part. It holds every coordinate system that puts your network’s extent inside the part of the map you can see. The app applies the first one for you. When you pan or zoom the preview, the app filters the list again. A zoom out widens the list. A zoom in narrows it to the systems that put the network exactly here.
If you choose a coordinate system directly, the app applies it at once and fits the preview to the network. The app clears the candidate list, then fills it again from where the preview lands.
-
Look at the preview. The app draws the network over a light base map. Make sure that the mains sit over the streets, and that the outline sits where the system it serves actually is. The zoom controls and Fit to extent are at the bottom right of the preview.
-
Work down the candidates with the network on screen. Each click reprojects the preview and leaves the map where it is. The network jumps from candidate to candidate, and the wrong ones move out of view.
-
Press Apply projection.
On an import, the app converts the file’s coordinates and loads the model. From the Map tab, the app converts the model in place — see Changing the projection later.
When the search does not help
Section titled “When the search does not help”- Projection out of bounds means that the system you chose sends your coordinates outside the range of longitude and latitude. Usually the system belongs to another part of the world, or the file’s numbers are not in a projected system at all. The preview drops the base map and draws the network near the origin. Apply projection stays grayed until you choose another system.
- No matching projections found here means that no system in the list projects your network into the view. Zoom the preview out, or search somewhere else.
- Search by location service is unavailable. Try again later or use a EPSG code or projection name means that the app cannot reach the geocoder. Search by code or by name still works. Only place names are affected.
- A system marked deprecated sorts to the bottom of every list, so the first entry the app offers is a current one.
Continuing without a base map
Section titled “Continuing without a base map”Continue without basemap is the other answer. It is the right one when the model has no true location, for example a training network, a hydraulics exercise or a schematic drawn to relative dimensions. It makes the project an X-Y grid, centered on the network itself. The project keeps the coordinates the file already had.
On an INP import, the app also gives the grid a scale. It compares each pipe’s
declared length against the straight-line distance between its end nodes, and
takes the median ratio. Distances measured on the grid then agree with the
lengths in [PIPES], whatever unit the file’s coordinates were in.
What an X-Y grid project does not have
Section titled “What an X-Y grid project does not have”| Not available | Instead |
|---|---|
| Base maps and satellite imagery | A grid, with a scale bar at the bottom left in the project’s length unit |
| The Layers section of the Map tab | Nothing, because custom layers have nothing to line up with |
| The Elevations section, and elevations fetched as you draw | Type elevations in, or bring them in with the model |
| File > Import > Zones | Grayed out |
| Allocate customer points | Grayed out, because allocation is a distance calculation on the ground |
| The terrain band behind an HGL profile | The app draws the profile itself as normal |
Everything else is the same: drawing and editing, the data tables, symbology, Network Review, running the model, reading results, graphs, and every export. See The map and its layers, Elevations, Zones, Customer points and HGL profile.
Changing the projection later
Section titled “Changing the projection later”The Map tab of the side panel ends with a Projection section. What that section holds depends on the project:
- On an X-Y grid project, a Set map projection button. It opens Network projection with the network drawn in its own grid coordinates, and you then search in the same way. Here Continue without basemap only closes the dialog and leaves the grid as it was.
- On a project in a named coordinate system, the system’s name and its EPSG code, with a pin button beside them. The button reopens Network projection with that system already selected, so you can compare it against its neighbors. The secondary action reads Remove basemap instead. That action turns the project into an X-Y grid with the same coordinates.
- On a project in longitude and latitude,
WGS 84andEPSG:4326, and no button. There is nothing to convert.
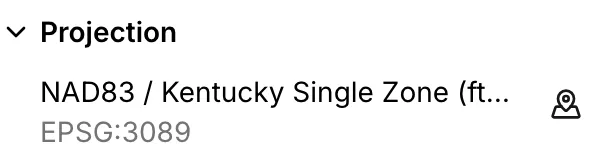
The whole section goes read-only while a scenario exists, and while the app plays back the results of a run. Close the scenarios first — see Scenario work.
Two things a reprojection deliberately leaves alone:
- The app does not fetch elevations again. The values already on the nodes stay as they are. That is what you want if the values came in with the model. It is not what you want if the app looked them up at the wrong location. If the network moved somewhere new, use Recalculate all elevations in the Elevations section afterwards. See Elevations.
- The app does not compute pipe lengths again. Each pipe keeps the Length it already had. A length read from an INP, or typed in by hand, survives the move unchanged. See Pipes.
What the projection controls on the way out
Section titled “What the projection controls on the way out”The app writes every export in the project’s projection, with one exception for GeoJSON. If you imported a file with the correct projection, the export has the same numbers as that file:
- An EPANET INP carries
[COORDINATES]and[VERTICES]in the project’s own system. - A GeoJSON export names the system as an EPSG URN, in the
crsmember of the file. A system with no EPSG code has no URN. On such a project, the app writes the GeoJSON in longitude and latitude (WGS 84) instead, with nocrsmember. GIS software assumes longitude and latitude for a GeoJSON that does not declare a system. - A Shapefile export writes a
.prjbeside it, with the WKT definition of the system. On an X-Y grid project, that.prjholds a local coordinate system in meters, not a real-world system. As a result, GIS software places the network at the origin.
See Import and export.
- Bring in an existing model — where most readers meet this dialog first.
- Projects — the projection choice on a new project, and what else the project file holds.
- The map and its layers — base maps, custom layers and the grid.
- Elevations — what a projection makes possible, and what to run after a reprojection.
- Import and export — the coordinates every export is written in.