
Energy
Every run calculates how much energy each pump used and what it cost. The answer goes into an Energy results section on the pump. You do not turn anything on for this to happen. What you set beforehand only changes how good the numbers are: an efficiency, a price, and a pattern for a price that varies through the day.
Energy has two levels. The project-wide defaults live in Simulation settings. Each pump can override them where you know that pump better. This page covers both levels, and what a run gives back.
Energy is worth an extended period run even when the hydraulics are not. A cost per day and a peak demand mean nothing at a single moment. See Time analysis mode on Simulation settings.
The project-wide defaults
Section titled “The project-wide defaults”Simulation settings > Energy holds five rows.
| Row | Starts at | What it does |
|---|---|---|
| Report energy usage | No | Adds a per-pump energy and cost summary to the simulation report |
| Global pump efficiency | 75 | The efficiency, in percent, of every pump with no efficiency curve of its own |
| Global energy price | 0 | The cost per kilowatt-hour for every pump with no price of its own |
| Global energy price pattern | — | A pattern that shapes that price through the day |
| Demand charge | 0 | The charge on the peak power the network draws, per unit of power |
Global energy price starts at 0, and it is the row to change first. At 0, every cost the app reports is zero. A run that looks like it produced no energy results usually produced free ones.
Global energy price pattern lists only the patterns filed under Energy price. With no such pattern in the project, the selector stays disabled and reads No patterns yet. You can make one in the patterns library. You can also reclassify an existing pattern with Set as Energy price. See Patterns.
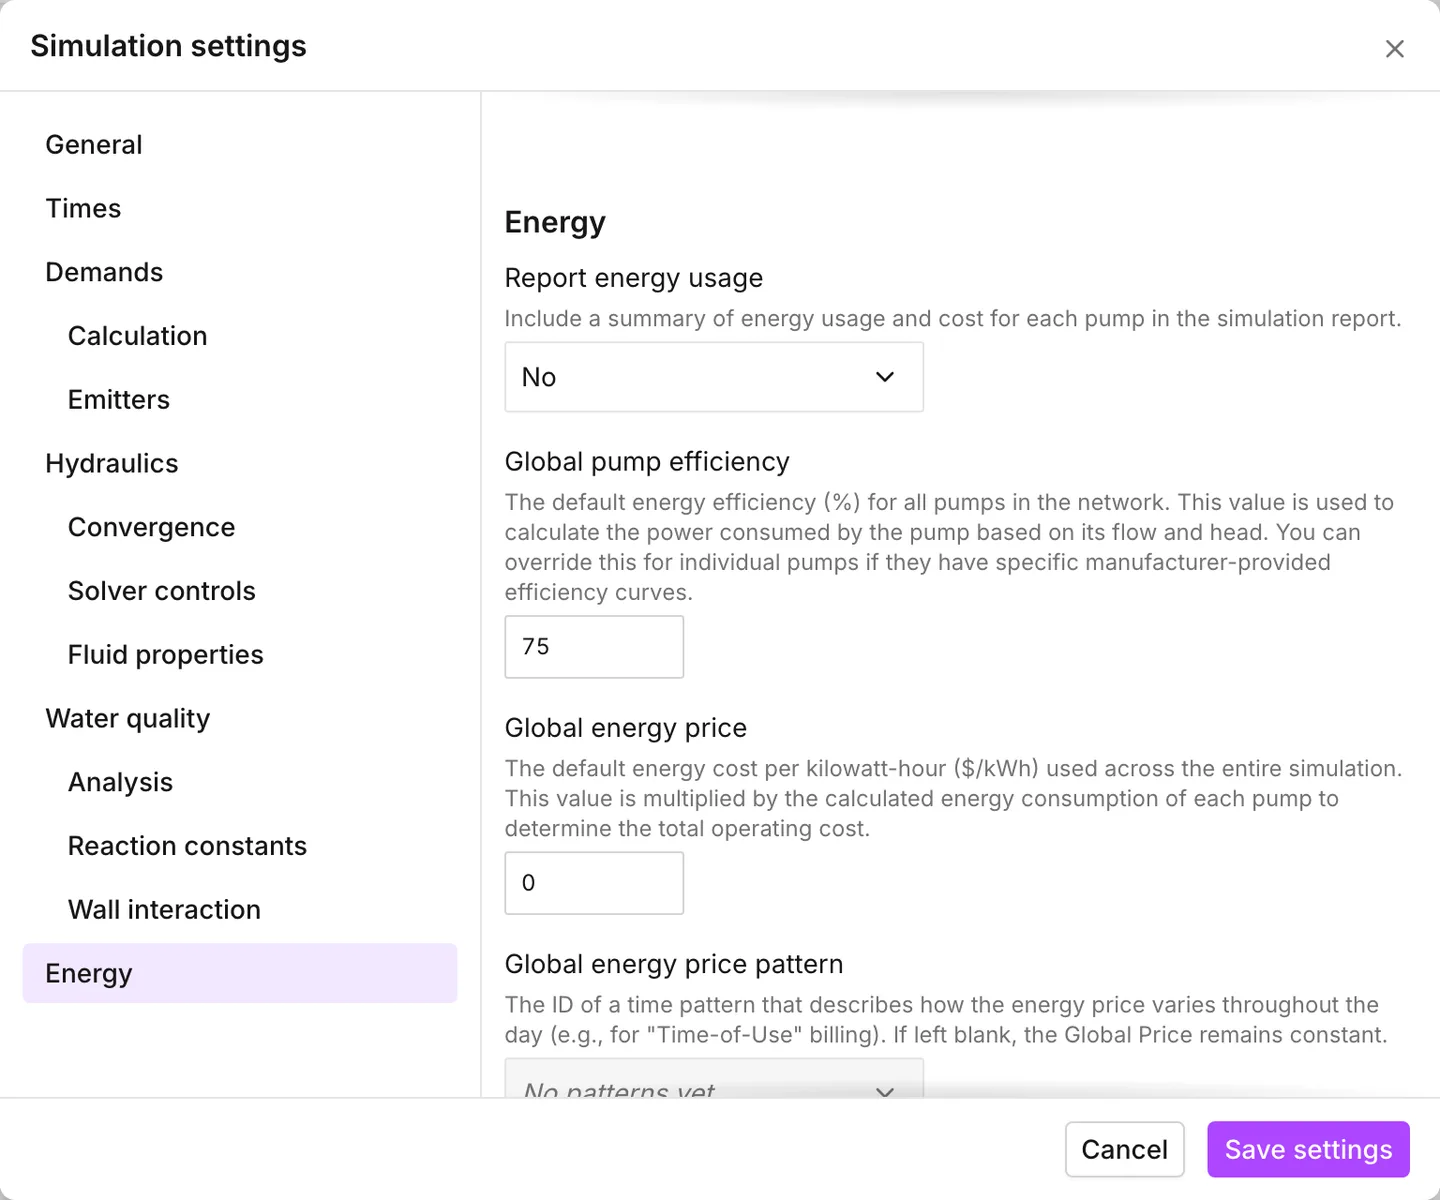
Report energy usage is the only row here that changes what EPANET writes rather than what it calculates. At Yes, the simulation report gains a table of energy and cost for every pump. At No, the same figures are still on the pumps in the panel.
A pump’s own values
Section titled “A pump’s own values”The Energy section of a pump has three rows, and every row is optional. A blank row falls back to the project-wide value. The app shows that value as the placeholder, so you can see what a blank row is worth without leaving it.
- Efficiency curve — an efficiency curve from the pump library. With no curve chosen, the selector reads Constant 75%, or the current Global pump efficiency.
- Energy price — this pump’s price per kilowatt-hour. Empty means the global price.
- Price pattern — this pump’s price pattern. The empty option names the global pattern where there is one. Where there is none, it reads Constant.
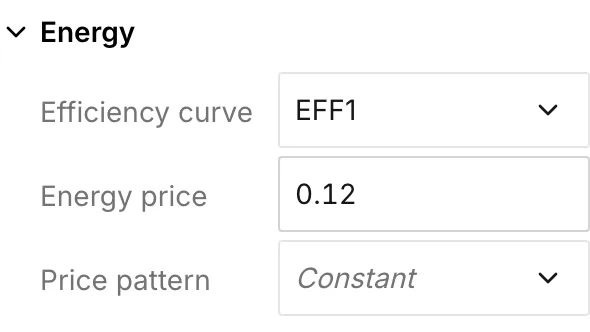
The section starts collapsed on a pump panel, below Controls. See Pumps for the rest of what a pump carries.
A real efficiency curve turns an energy figure from an order of magnitude into a number worth quoting. A fixed 75% across the whole operating range overstates a pump that runs well off its best efficiency point. That is exactly the pump a study is usually about.
Where the three values come from
Section titled “Where the three values come from”- Efficiency curve — the manufacturer’s test curve for that pump. The EPANET 2.2 manual asks for wire-to-water efficiency. This efficiency takes in the mechanical losses in the pump and the electrical losses in its motor. The manual says the curve is only for the energy calculation. It never changes the hydraulics. See Curves for the shape it expects.
- Energy price — your own tariff, per kilowatt-hour. EPANET carries no currency. The manual’s energy options say that monetary units are not explicitly represented. The costs come back in the unit you priced the energy in. The one rule is that every pump in a model uses the same unit.
- Price pattern — the shape of a time-of-use tariff over the day, as a multiplier on the price. The manual describes it as a pattern for the variations in energy price with time. Where it does not apply, this field stays blank.
While every pump is on the same tariff and no pump has a test curve to hand, the global values are good enough. That is a first pass, or a model whose question is not about energy. The global values stop being good enough when the answer is a comparison. Two control regimes, or two pumps of different ages on the same duty, differ by exactly the efficiencies and prices that the global values flatten.
The run includes only the pumps that are enabled, and their energy rows with them. A pump switched out of the active topology adds nothing to the energy for that run.
Energy results
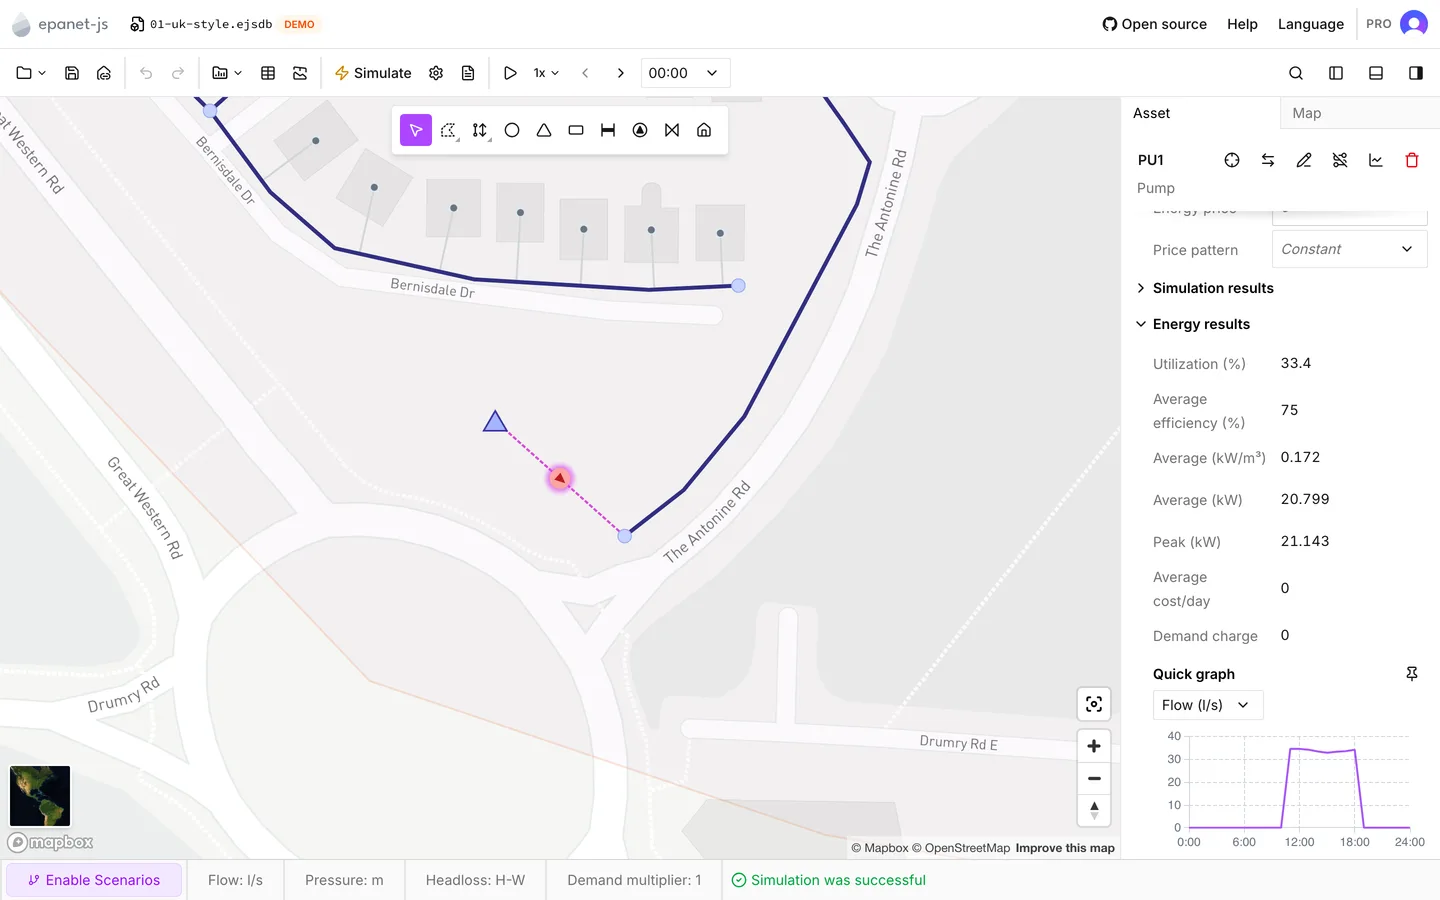
Section titled “Energy results”Energy results is the last section of a pump’s panel, below Simulation results, and it also starts collapsed. It holds seven rows. Unlike every other result in the app, these rows are whole-run figures rather than values at the current timestep. None of them moves with the time browser.
| Row | What it is |
|---|---|
| Utilization | The share of the run the pump was on, as a percentage |
| Average efficiency | The efficiency the pump ran at, averaged over the run |
| Average | Energy per unit of volume pumped, in the unit on the row |
| Average | The average power draw while the pump is on |
| Peak | The highest power draw at any timestep |
| Average cost/day | Energy cost per day, at the price and pattern in force |
| Demand charge | The charge on the network’s peak power |
The units tell the two rows named Average apart. The first is per unit volume. The second is power.
Demand charge is the one row that is not about this pump. It is a single figure for the whole network: the charge on the peak power the network drew at any point in the run. Every pump’s panel shows the same value. If you read it off two pumps and add them, you count it twice.
Average efficiency is the row a decision usually turns on. It is the only row that says whether the pump works where it was meant to work. It is also the row you can act on. A pump that averages well below its best efficiency point is a case for a different impeller, a different duty, or a different control regime.
Utilization is the row to read beside it. Utilization says how much of the day you pay for that inefficiency. A pump on all day at 40% is a different problem from one that cycles for two hours at 78%. Average cost/day is then the size of the prize rather than the diagnosis. When you decide which pump to look at first, this row is the one to rank the pumps by.
Across several pumps
Section titled “Across several pumps”When you select more than one pump, the multi-asset panel carries the same two sections. Where the pumps hold different values, a row shows the count of them with a button beside it. The button opens Min, Max, Mean and Sum across the selection. This is the quickest route to a network total. The panel leaves Energy results out until there are results to summarize. See The asset tab.
What travels in an INP
Section titled “What travels in an INP”An export writes the four global values into [ENERGY], and
Report energy usage into [REPORT]. For each pump, it writes one line for
each of Efficiency curve, Energy price and Price pattern that the
pump sets. An import reads the same sections back. An export does not write a
global value that is at its default. Its absence from an exported file means it
is at the default rather than lost. See
Import and export.
- Pumps — the pump itself, and what else it carries.
- Pump library — where efficiency curves come from.
- Patterns — building an energy price pattern.
- The simulation report — the energy summary Report energy usage adds to it.