
Draw a model
The other three jobs start from something you already have: GIS layers, an INP, or a model that you test changes against. This job starts from nothing. You open a blank project on a real basemap and place every asset yourself.
This job suits a network that is small enough to draw: a site, a rural scheme, a single zone, or a test network for something you want to try. It is also the quickest way to meet all eight drawing tools. A first model needs seven of them, in about a quarter of an hour.
The steps that follow build a small pumped system over Drumchapel, in the north-west of Glasgow. They end with a run and a pressure you can read. This job needs no account, no files and no plan, because everything it uses is open to anyone.
Drawing and editing is the reference for the tools themselves. It gives what each click does, what merging and splitting mean, and how undo behaves. This page gives the order to use the tools in.
What you are building
Section titled “What you are building”The network has a reservoir at the low end and a pump that lifts into a rising main. A tank stands on the high ground. Below the tank, a short branched distribution network carries demand through a valve. That is seven assets and about a dozen pipes. The network is small enough to draw in one sitting, and complete enough to run.
-
Start a blank project
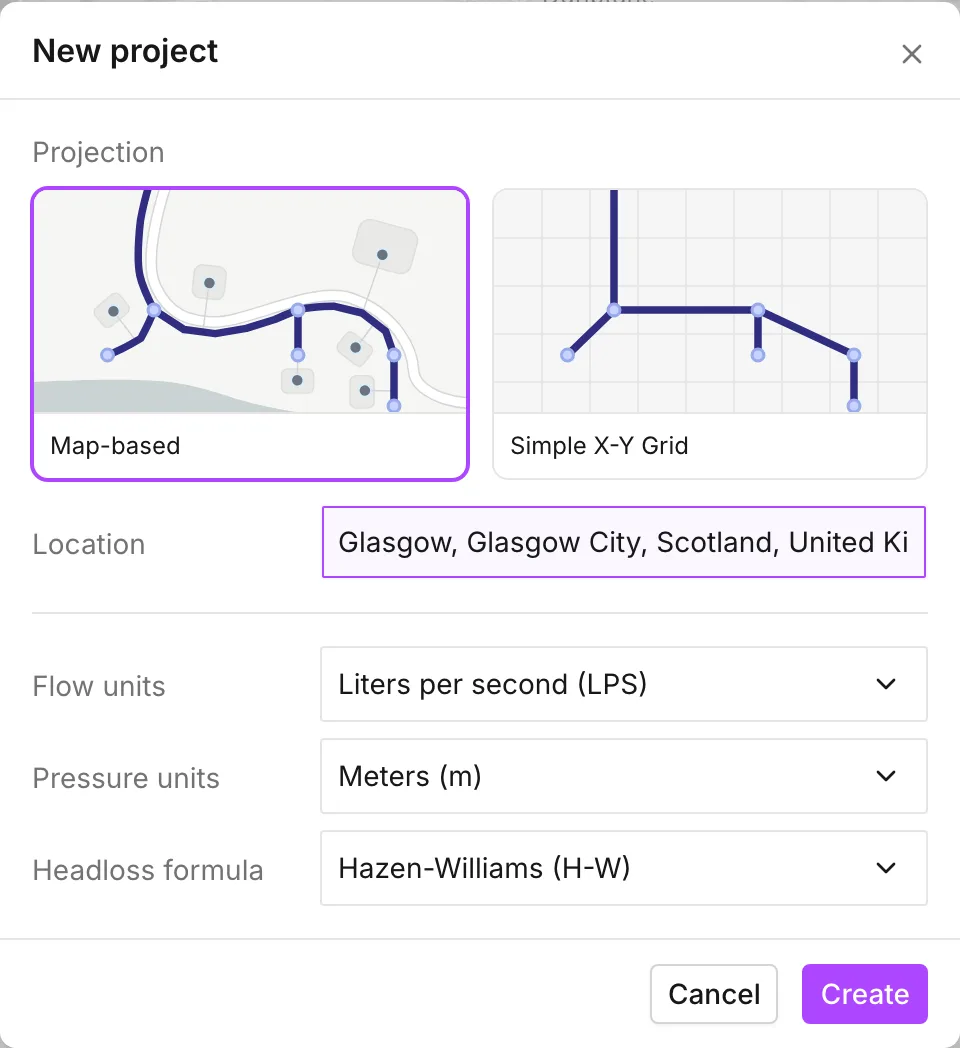
Section titled “Start a blank project”Press Start project on the welcome dialog. File > New project > Blank project and Alt+N do the same. The New project dialog asks five things.
Leave the projection on Map-based. You draw on real ground, so you want real coordinates and terrain under the network. The other card is Simple X-Y Grid, for a schematic with no position on the earth.
Location takes a place name and frames the map there. It searches places and localities, so a district or a suburb is often not in the list. In that case, search for the town or city around it, then pan from there. For this walkthrough, search
Glasgowand take the Glasgow City, Scotland result.Leave the last three at their defaults:
- Flow units on Liters per second (LPS).
- Pressure units on Meters (m).
- Headloss formula on Hazen-Williams.
All three are fixed for the life of the project. On a real model, this is the moment to get them right. Press Create.
-
Zoom in before you draw
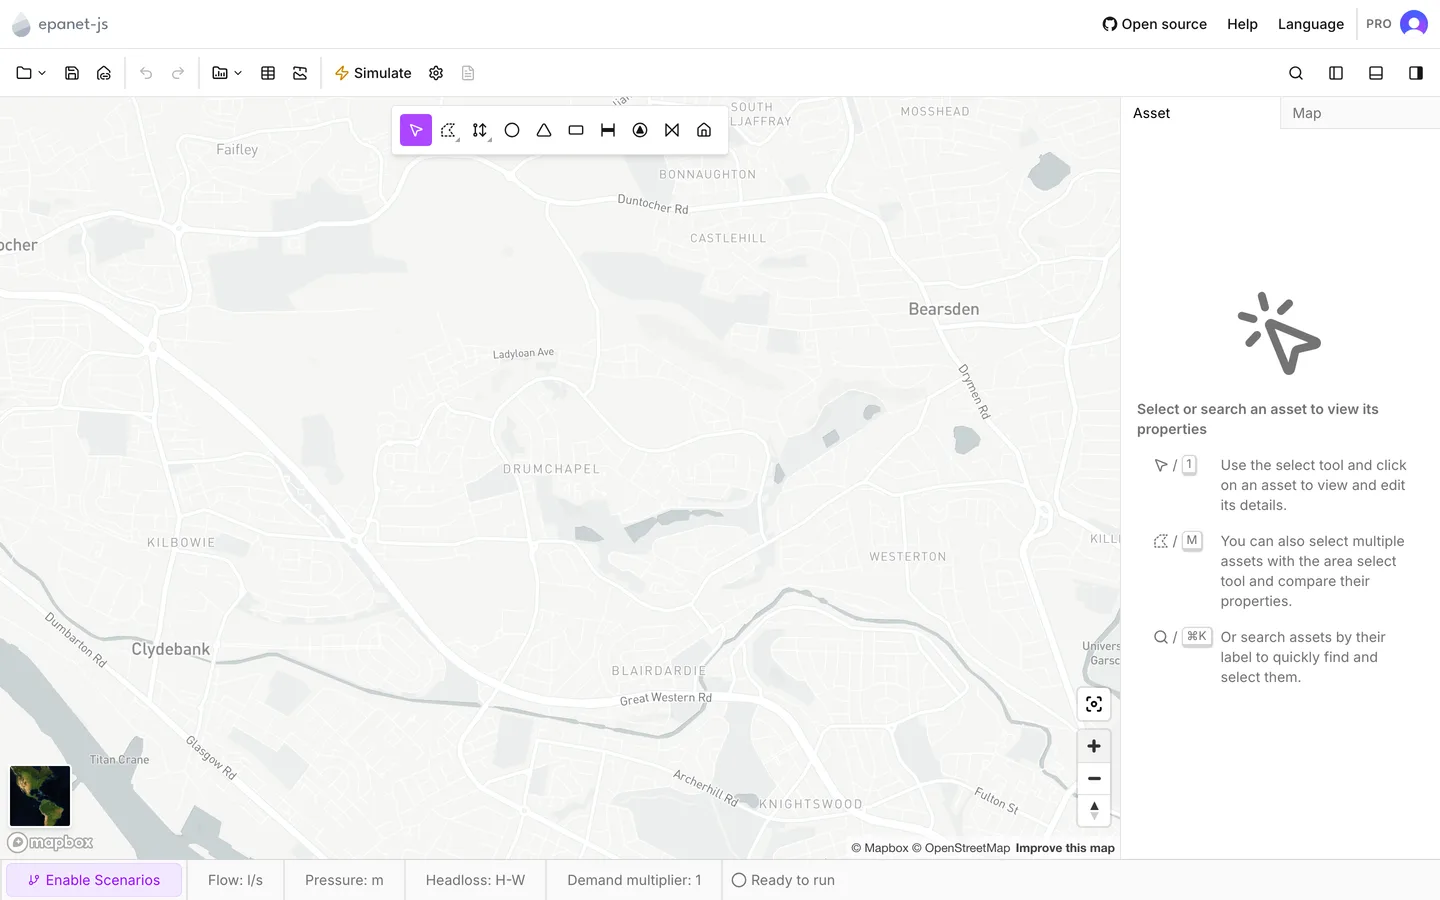
Section titled “Zoom in before you draw”Location frames the whole city, which is too far out to draw over. Pan north-west to Drumchapel. Zoom in until you can see individual streets.
Zoom in before you place anything. The app measures pipe lengths off the geometry you draw, and it reads elevations from the terrain under each node. A network drawn at city zoom is a network with the wrong lengths in it. A later zoom does not correct them. Only redrawing does.
The map toolbar floats at the top center of the map. Every tool on this page comes from it. A tool stays active until you choose another one.
Esc or 1 returns you to Select.
-
Place the reservoir
Section titled “Place the reservoir”Take Reservoir (3) and click on the low ground at the south-west of the area. The reservoir is the source. It is a boundary at a fixed head, and it supplies whatever the network asks of it.
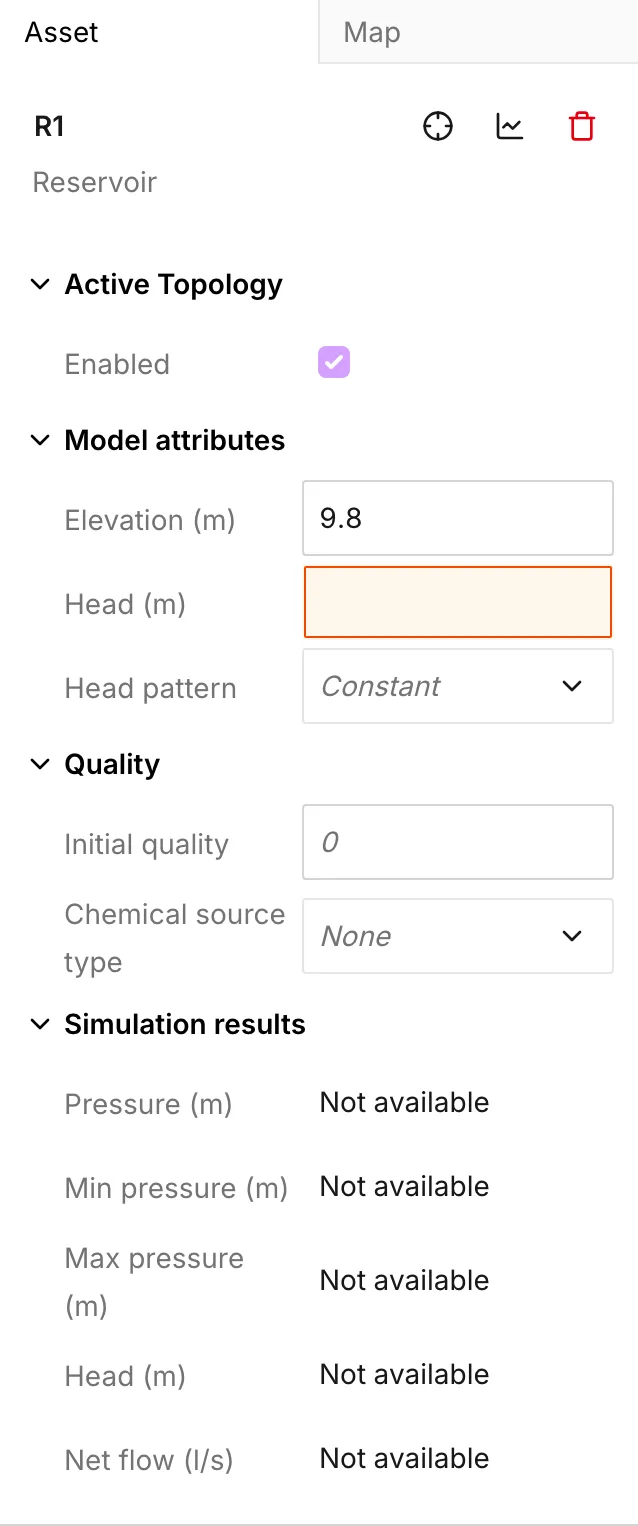
The app selects the new asset at once. The side panel opens on the Asset tab, at the first field the model is missing. For a reservoir that field is Head, and it arrives empty. The app fills Elevation beside it from the terrain. Across this view, Elevation comes back between about 10 m on the flats by the Clyde and about 80 m on the higher ground towards Bearsden.
Head is an absolute head on the same datum as every elevation in the network. It is not a depth. Set it above the ground under the reservoir. 30 m does for this network. It leaves about 20 m of standing head at the source, and it lets the pump lift the water to the tank. See Reservoirs.
-
Draw the pump out of it
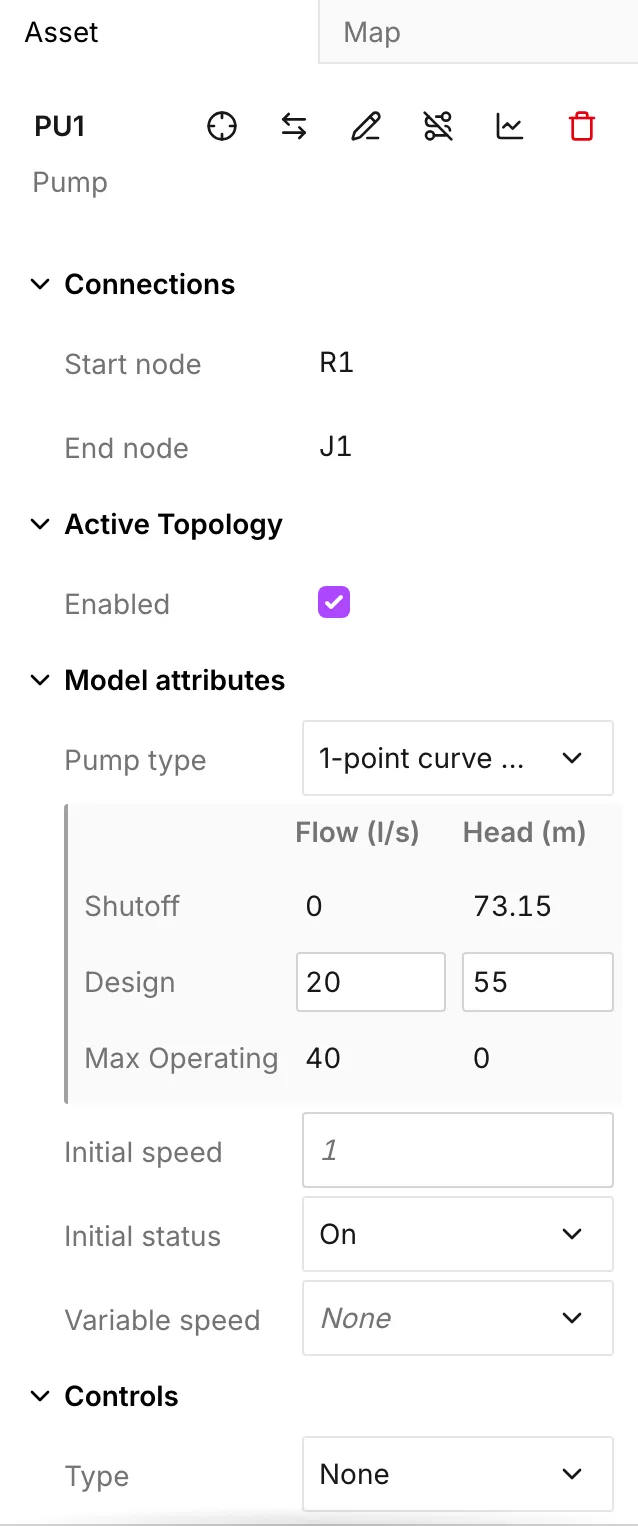
Section titled “Draw the pump out of it”A pump is a link, not a point, so it needs a node at each end. Take Pump (6). Click on the reservoir to start there. Double-click a short distance away to finish in open ground. The app creates a junction at the second point. The pump moves water in the direction you drew.
A new pump arrives as a 1-point curve (design point), with the point empty. Type a duty point into the Design row. Use 20 l/s at 55 m for this network. That is enough to lift from the reservoir to the tank you place next. The app fills the shutoff and maximum-operating rows from it. See Pumps.
-
Place the tank
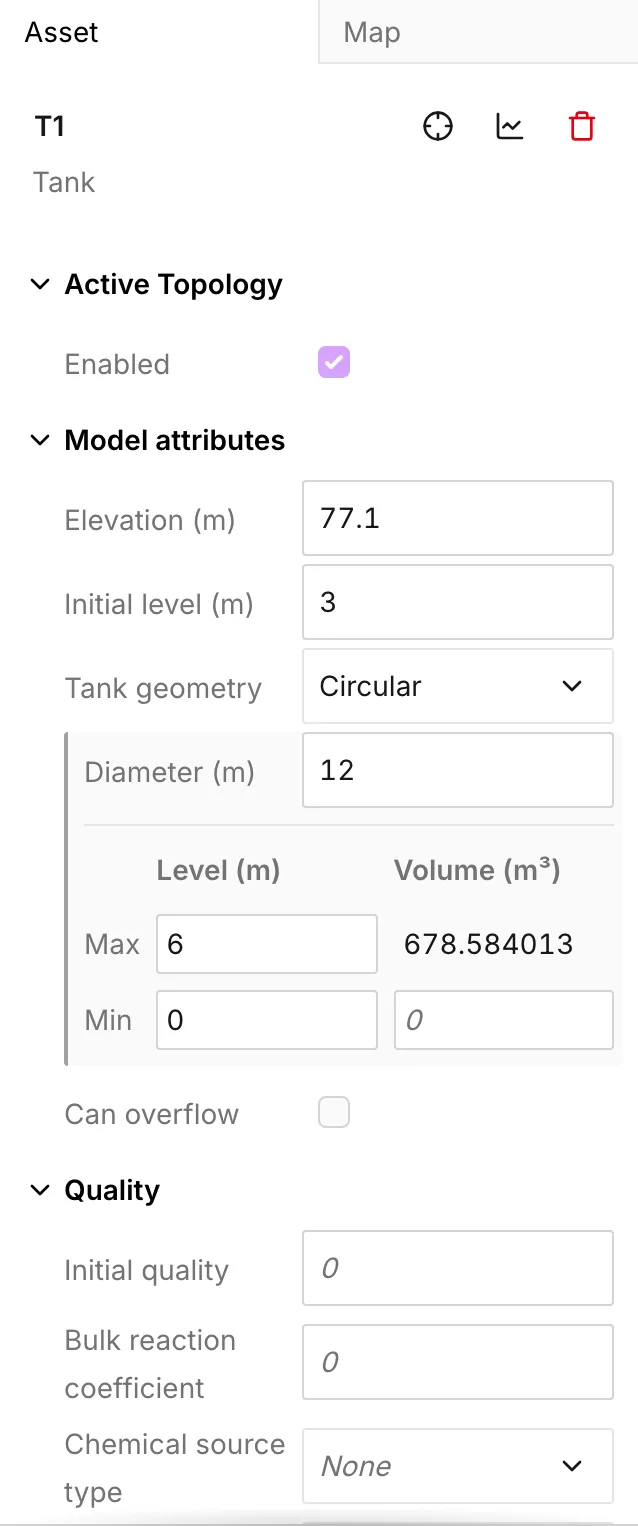
Section titled “Place the tank”Take Tank (4) and click on the high ground to the north-east. The app reads Elevation from the terrain, as the floor of the tank. Every level on the tank is measured up from that floor. Everything else is blank, so the panel opens with work to do:
- Tank geometry on Circular, with Diameter 12 m.
- Initial level 3 m, Min level 0 m, Max level 6 m.
See Tanks for what the other three geometry options ask for.
-
Draw the rising main, and watch it snap
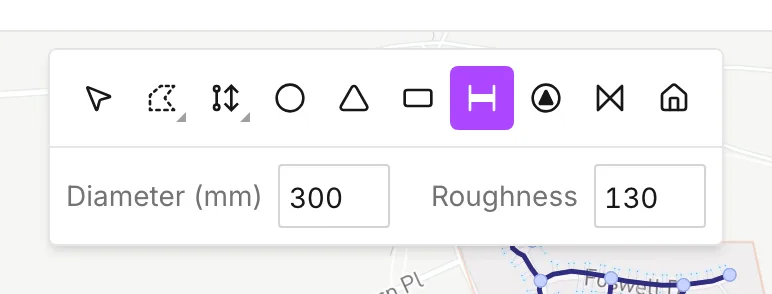
Section titled “Draw the rising main, and watch it snap”Take Pipe (5). A strip appears under the tools. It shows the Diameter and Roughness that the app gives to new pipes: 300 mm and 130 on a new metric project. Every pipe you draw takes the values in the strip. Set the strip before a run, rather than correct each pipe afterwards. Leave it at 300 mm for the rising main.
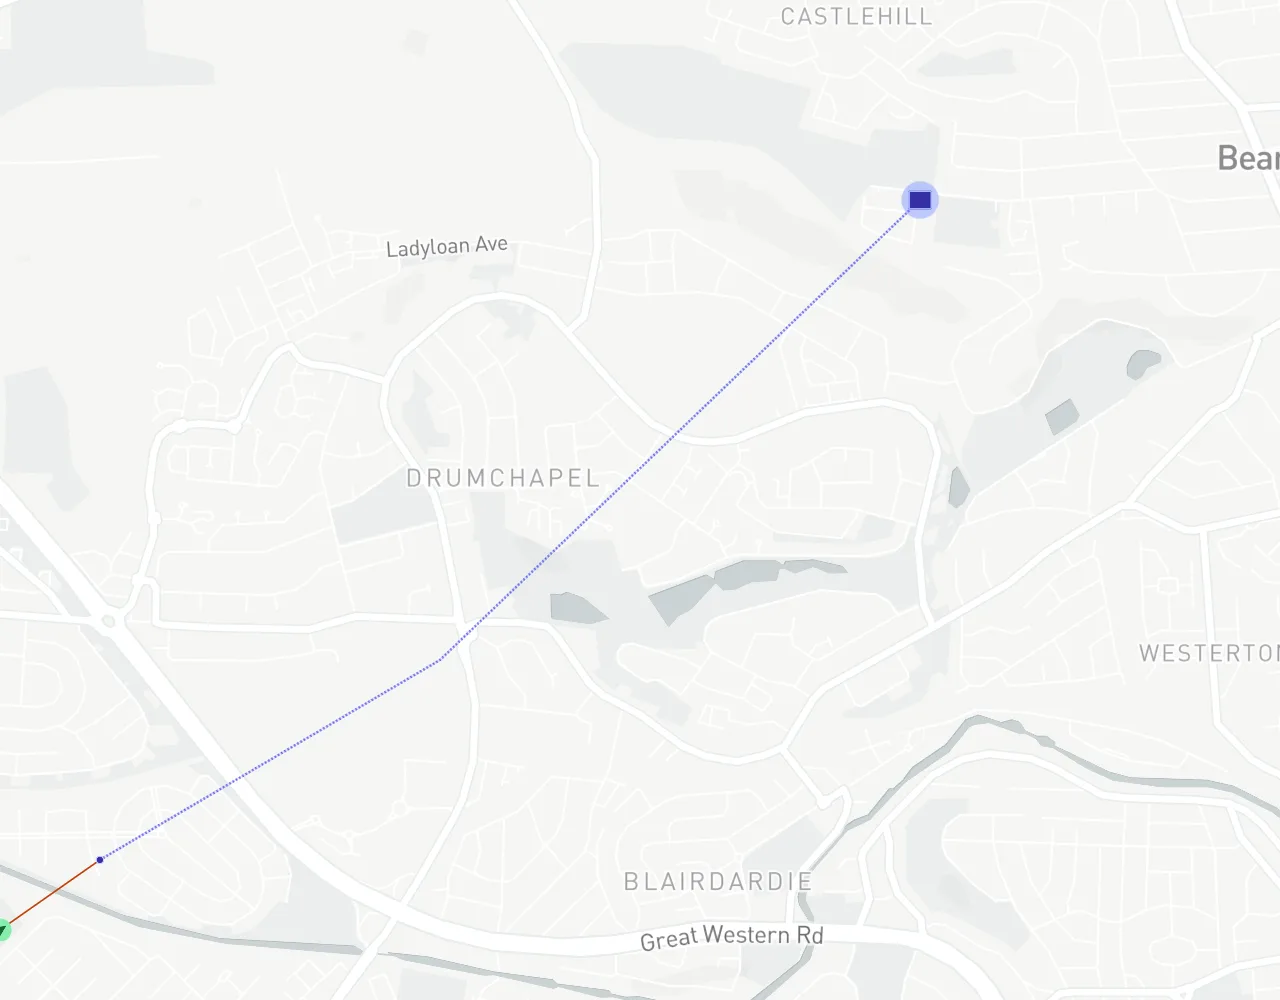
Click the junction at the outlet of the pump to start. Click once or twice along the route to add vertices. Click the tank to finish. When the pointer comes near an existing node, the pipe snaps to the node and the app highlights the node. That highlight is the difference between a pipe that connects and a pipe that ends a few centimeters short. A pipe that ends short leaves the network broken in two.
Two modifier keys are worth knowing now rather than later:
- Shift, held as you click, stops the snapping and puts the vertex exactly where the pointer is. It helps when a genuine crossing runs close to a node that it must not join.
- Ctrl, held as you finish, ends the pipe and starts the next one from the junction just created. This is how you draw a continuous main without a return to the toolbar between spans.
Esc abandons a pipe part-drawn. The app adds nothing to the model until you finish a link.
-
Draw the distribution network
Section titled “Draw the distribution network”Set the strip to 150 mm. Then draw the rest below the tank: a main out of the tank, and two or three branches off it. If you finish a branch in open ground with a double-click, the app creates a junction at the last point. If you finish it on an existing junction, the two runs join there.
At times you need a node that no pipe end lands on, for example a connection point part way along a span. In that case, take Junction (2) and click on the pipe. The app splits the pipe in two at that point. Both halves keep the diameter and roughness of the original pipe, and the app measures both lengths again from the new geometry.
-
Put demand on the junctions
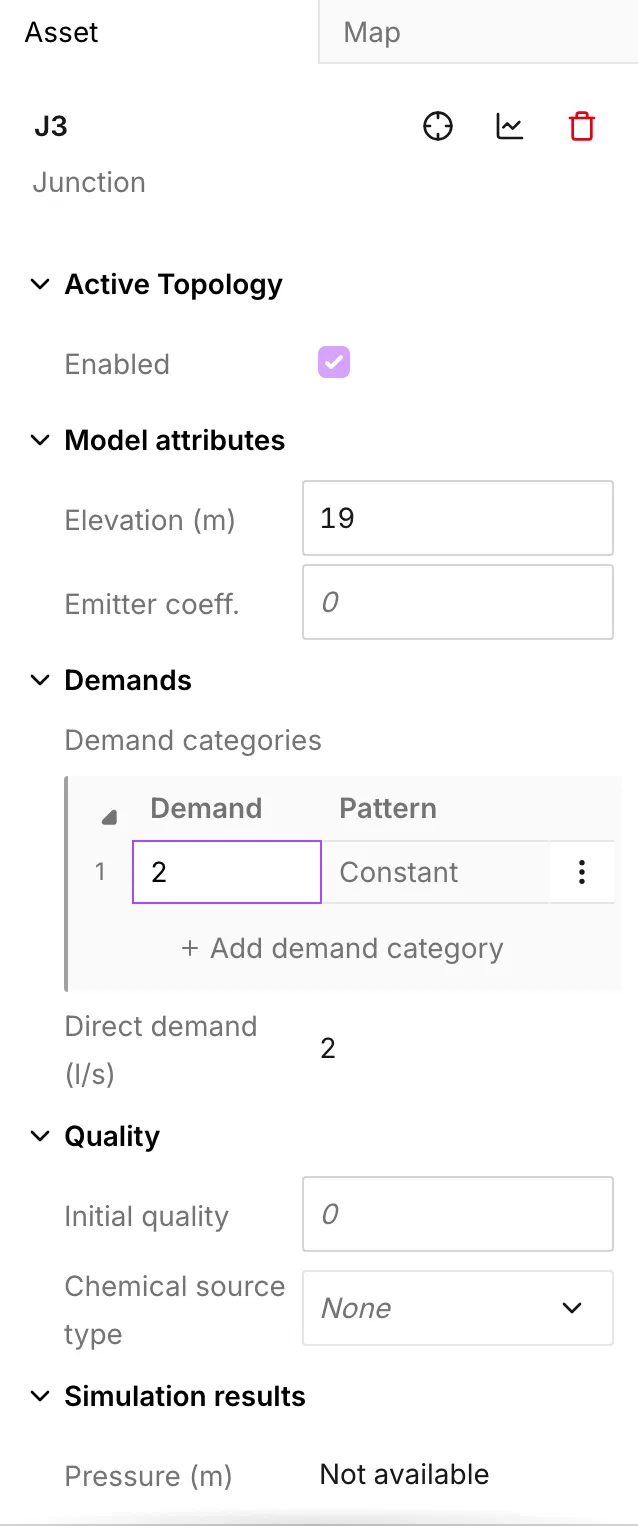
Section titled “Put demand on the junctions”A network with no demand has nothing to solve. Select a junction and open Demands in the Asset tab. A junction with no demand yet shows one Add direct demand button. Press it to get the first row of the Demand categories grid.
Type a Demand into the row. 2 l/s at each of the junctions on the branches is enough for this network. Leave Pattern on Constant. A pattern makes the demand vary through the day, and it needs a duration as well. See Patterns and Simulation settings.
With several junctions selected at once, you can set Demand for all of them from the multi-asset panel. The Junctions tab of Data tables takes a paste from a spreadsheet.
-
Add the valve
Section titled “Add the valve”Take Valve (7) and draw it into the main below the tank. Click on the pipe to start, and click again a little further along to finish. The app splits the main at both clicks. The valve becomes a short link between the two new junctions. EPANET needs it this way, because a valve is a link and your pipe was in the way.
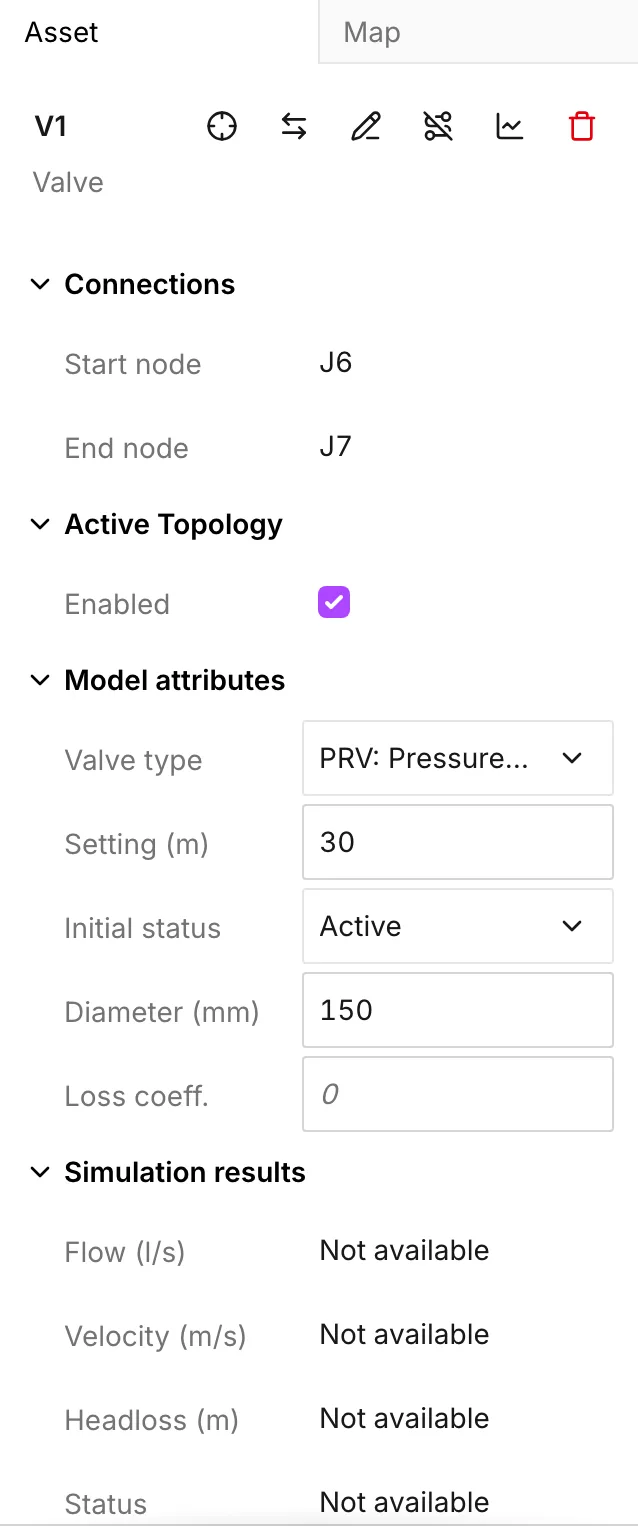
A drawn valve arrives as a TCV. It carries the Diameter from the pipe strip, and its setting is empty. Set Valve type to PRV (Pressure Reducing Valve). Then set Setting to 30. The setting is the pressure that the valve holds downstream, in the pressure unit of the project. Leave Diameter at 150 mm, the value from the strip. See Valves for the other six types.
The eighth tool is Customer point (8). It places individual service points and allocates their demand to the nearest pipe. This is a job of its own, and it needs pipes with diameters on them. Leave it until the network runs. See Customer points.
-
Check it before you run
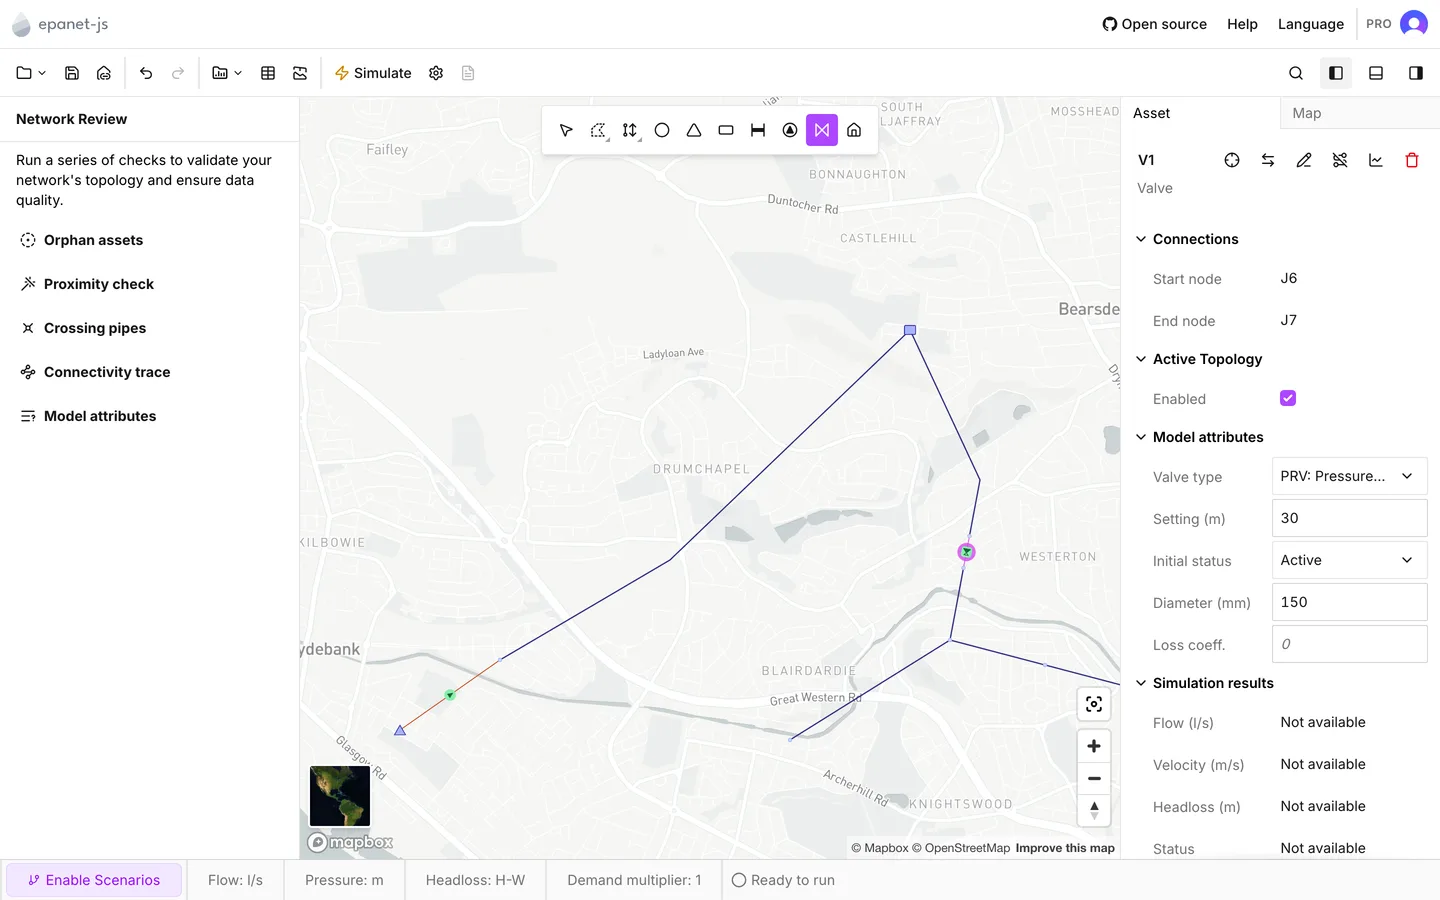
Section titled “Check it before you run”Press Toggle left panel in the toolbar and open Network Review. On a newly drawn network, two of its checks are immediately useful:
- Model attributes lists everything that is still missing a value the run needs: a junction with no elevation, a pump with no curve, a valve with no setting.
- Orphan assets and Connectivity trace find the breaks: a branch that ends a few centimeters short of the junction it looks joined to, or a section with no tank or reservoir to supply it.
Work through both lists before you run the model. When you click an entry, the app selects the asset it names and zooms to it. See Network review.
-
Run it and read a pressure
Section titled “Run it and read a pressure”Press Simulate, or press Shift+Enter. A model with problems opens Before running the simulation first. The dialog offers Review issues and Run anyway. At this stage, take Review issues, because what it reports is a drawing mistake rather than a modeling decision.
A clean run ends on Simulation was successful. The duration of a new project is zero, so this is a single-period run: one set of results, and no time browser. See Running a simulation.
Results reach you in three places. The first one is the place to look at now:
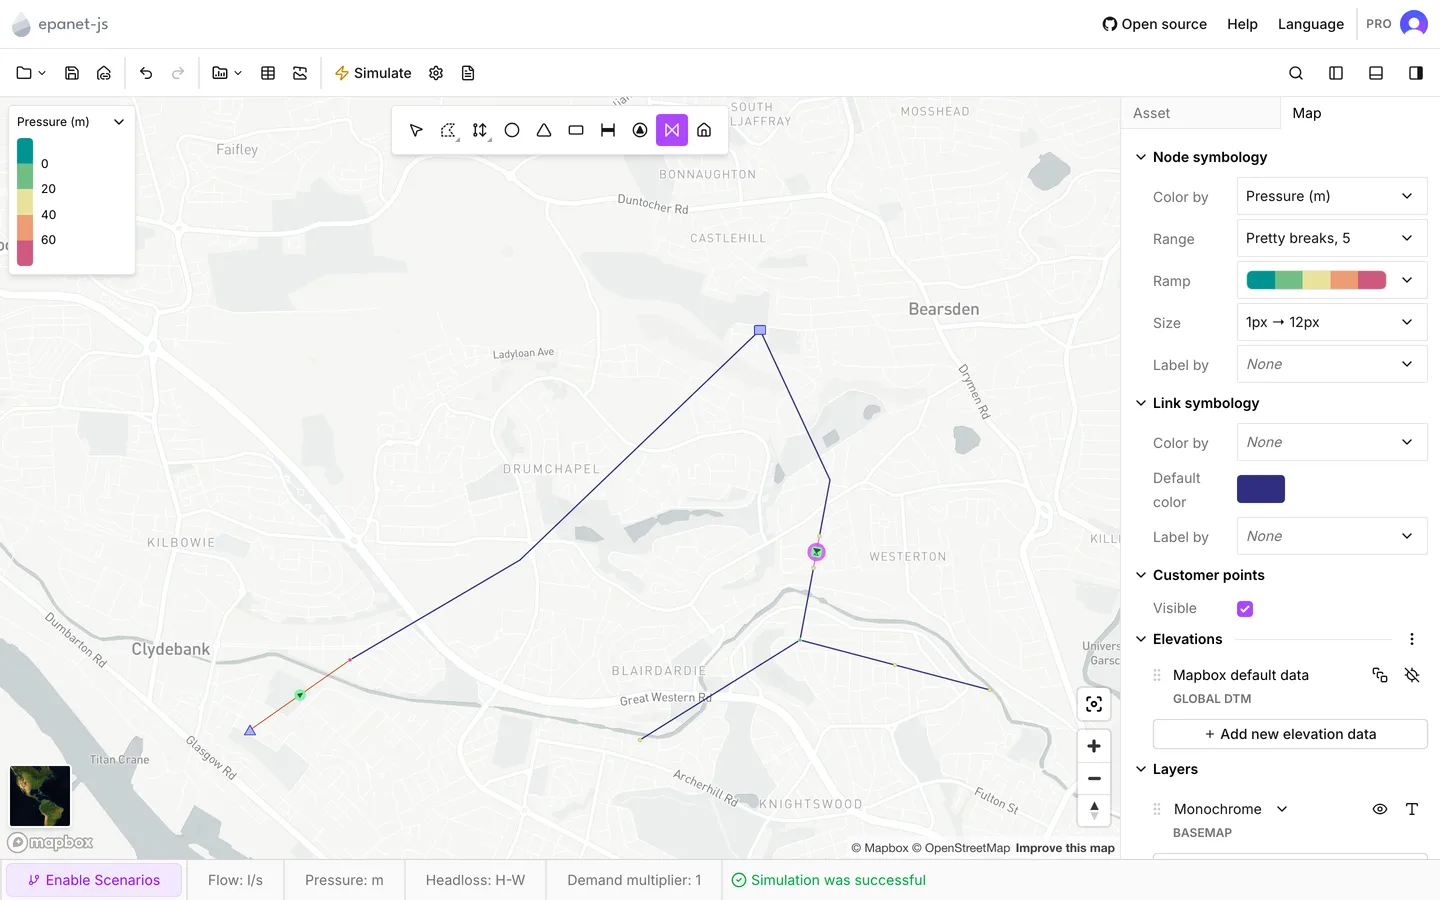
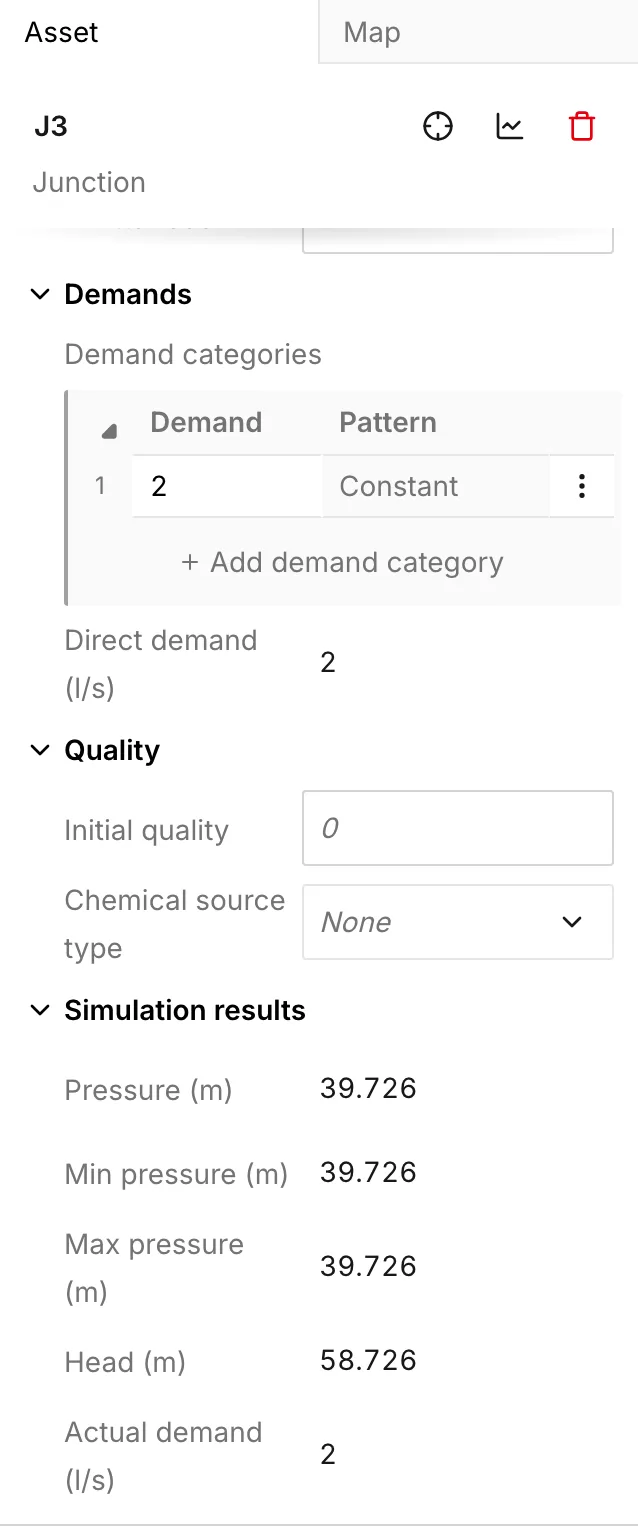
- Select a junction and read Pressure under Simulation results, at the foot of the Asset tab. On this network the junctions below the tank come back between about 10 m and 40 m. The junction immediately downstream of the PRV comes back at the 30 m you set it to.
- Color the map: Map tab > Node symbology > Color by > Pressure. See Symbology.
- Select everything with Ctrl+A. The Asset tab then gives Min, Max and Mean for any property across the whole selection.
-
Save it
Section titled “Save it”Save writes the whole project (network, demands, settings) to an
.ejsdbfile where you choose. Until you save, the project exists only in this browser. See Projects.
What a drawn model does not have yet
Section titled “What a drawn model does not have yet”The steps that come before give you geometry, connectivity, elevations and a single-period run. The operational data is still empty. Each piece of it has a page:
- Simulation settings, for a duration that turns the single period into an extended-period run.
- Patterns, to vary demand and the reservoir head through the day.
- Controls, to switch the pump on level in the tank rather than leave it running.
- Curves and the pump library, if you want a real pump in place of the design point.
- Customer points, if you want demand to come from service points rather than from numbers typed on junctions.
- Drawing and editing — the tools in full, and moving, merging, splitting, redrawing and reversing what you drew.
- Worked example: Rosebery — a longer exercise on a real town, built from GIS layers rather than drawn.
- Network review — the five checks, and which of them stop a run.
- Elevations — where the elevations came from, and how to read them again for a whole network.
- Build a model from GIS — the other way to get a network, when you have the layers for it.