
The interface
epanet-js runs in one browser window. There are no separate document windows. The map fills the middle. Everything else is a bar or a panel around it. You can close the panels to give the map the whole window.
This page names each part. The rest of the help center can then say “the toolbar” or “the status bar” and mean something.
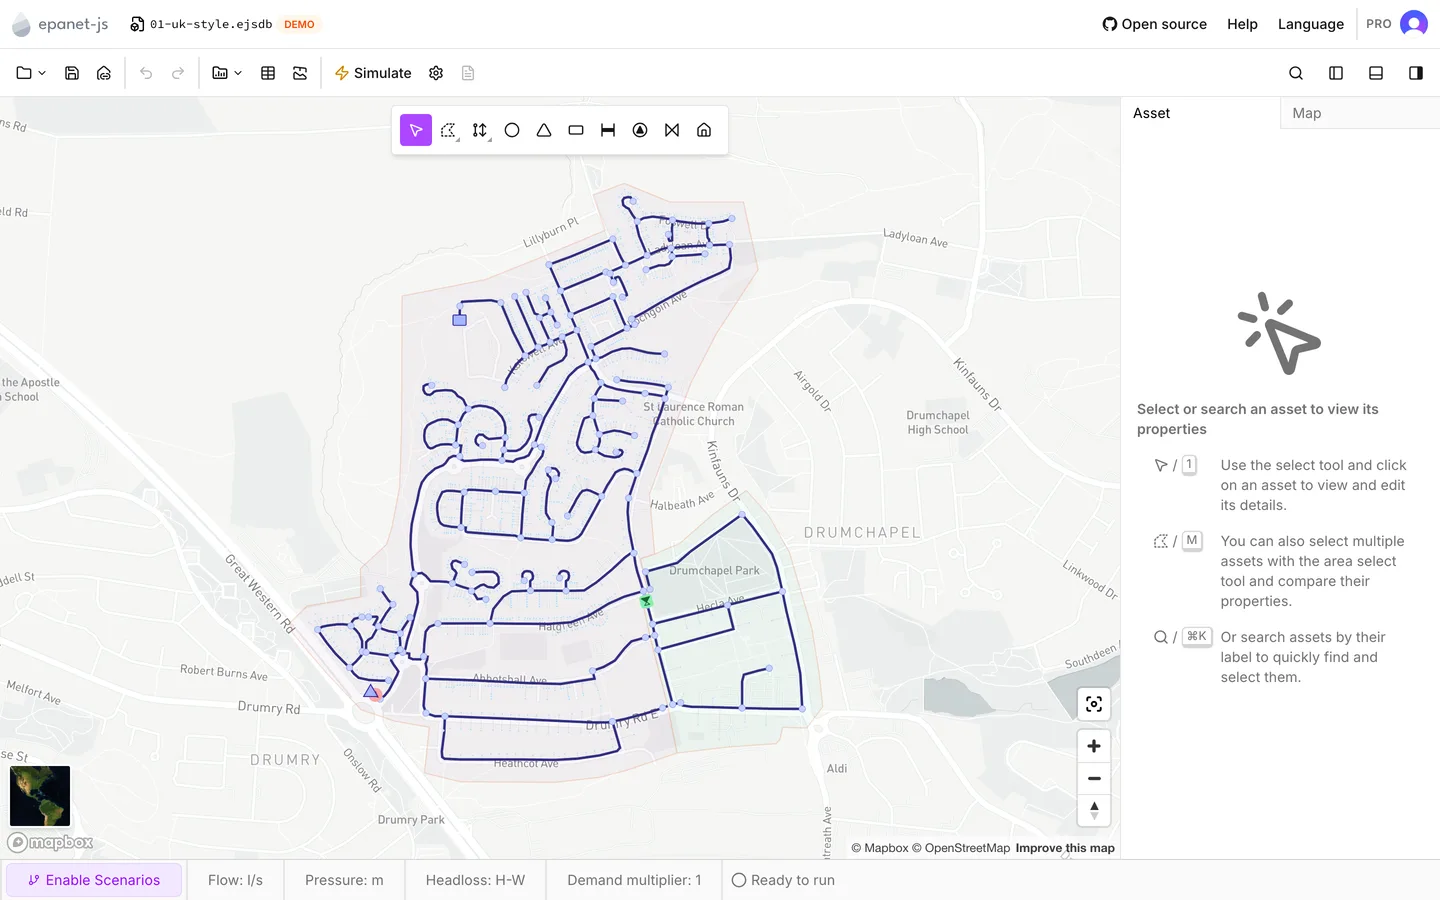
From top to bottom
Section titled “From top to bottom”| Part | Where | What it holds |
|---|---|---|
| Menu bar | Top row | The logo, the project name, Help, language, account |
| Toolbar | Second row | Files, editing, operational data, simulation, panels |
| Map toolbar | Floating at the top of the map | Select, the area and trace tools, the drawing tools |
| Activity bar | Left edge of the window | One icon for each panel on the left |
| Left panel | Left of the map | Network Review, or Collections |
| Side panel | Right of the map | The Asset and Map tabs |
| Bottom panel | Below the map | Data tables and the HGL profile |
| Status bar | Bottom of the window | Scenario, units, run status |
The menu bar
Section titled “The menu bar”The epanet-js logo at the left reopens the welcome dialog. Help >
Welcome page does the same. Next to the logo is the name of the project
file, with the .ejsdb extension. When the project has unsaved changes, a dot
appears next to the name. When the open project is one of the demo networks, a
Demo badge appears.

The right of the menu bar holds these controls:
- Open source goes to the repository on GitHub.
- Help opens a menu of Welcome page, Help center, Roadmap, Utility apps and Keyboard shortcuts.
- A language selector — see Languages.
- Sign-in, or your account and plan once you are signed in. On the free plan, this group also holds Upgrade, or the days left in a free trial. See Accounts and privacy and Plans.
The toolbar
Section titled “The toolbar”The toolbar is one row across the top. Its groups run from left to right:
- File — new projects, opening, saving, Import and Export. See Projects and Import and export.
- Save and Allocate customer points — see Customer points.
- Undo and Redo.
- Operational data — Patterns, Curves, Pump Library, Pipe library, Controls and Custom attributes. See Patterns and the pages beside it.
- Data tables, which opens the Open data tables dialog, and HGL profile. The tables and the profile both open in the bottom panel.
- Simulate, Simulation settings and View report. See Running a simulation.
- The time browser. This browser appears only after a run produces more than one timestep. See Reading results.
The right-hand end holds Search assets… and the three panel toggles.

The map toolbar
Section titled “The map toolbar”The tools that act on the map are not in the toolbar. They float in a small bar at the top center of the map itself. This bar holds Select, Select area, Selection trace, and then Junction, Reservoir, Tank, Pipe, Pump, Valve and Customer point. See Selecting and finding assets and Drawing and editing.
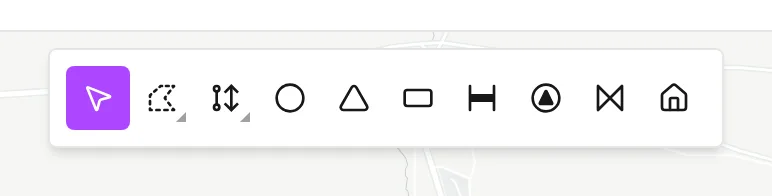
While the Pipe tool is active, a second row appears below the tools. This row carries the Diameter and Roughness for new pipes.
The panels
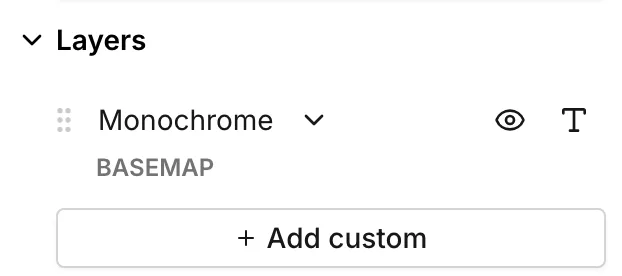
Section titled “The panels”The side panel on the right has two tabs. The Asset tab shows the properties of what you select — see The asset tab. The Map tab holds symbology, basemaps, layers, elevations, zones and the projection. See The map and its layers and Symbology. On a wide enough window, the side panel is open by default.
The Network Review panel on the left holds the five checks that read the model and report what is wrong with it. It starts closed, and opens by itself after a model build. See Network review. The Collections panel opens in the same place. It keeps named selection sets and bookmarks. See Collections.
The activity bar is the column of icons at the left edge of the window. It has one icon for each of the two panels. When the left panel is closed, the bar stays in place. You can use the icons in these ways:
- Click an icon to open its panel. If the other panel is open, the left panel changes to the panel of that icon.
- Click the icon of the open panel to close the left panel.
- Hover over an icon to see the name of its panel.
- Drag the icons to put them in a different order.
The bottom panel holds tabs rather than one thing. There is one tab for each data table that you open, and an HGL profile tab once a profile exists. The panel holds no table until you open one. Data tables in the toolbar opens the Open data tables dialog. In this dialog you tick the tables to add: Junctions, Pipes, Pumps, Valves, Reservoirs, Tanks and Customer points. HGL profile opens the panel on the profile.
The bottom panel starts closed. It reads Nothing here yet until you open something. Each tab has an × that closes it. You can drag the tabs into a different order. When there are more tabs than fit, Scroll tabs left and Scroll tabs right appear at the ends of the strip. See Data tables and HGL profile.

Each of the three has a toggle at the right of the toolbar and a shortcut:
| Panel | Toggle | Shortcut |
|---|---|---|
| Left panel, Network Review or Collections | Toggle left panel | Ctrl+B |
| Bottom panel | Toggle bottom panel | Ctrl+J |
| Side panel, on the right | Toggle side panel | Ctrl+Shift+B |
Drag the edge between a panel and the map to resize it. If you reopen a panel with its toggle, the panel returns to its default width.
The status bar
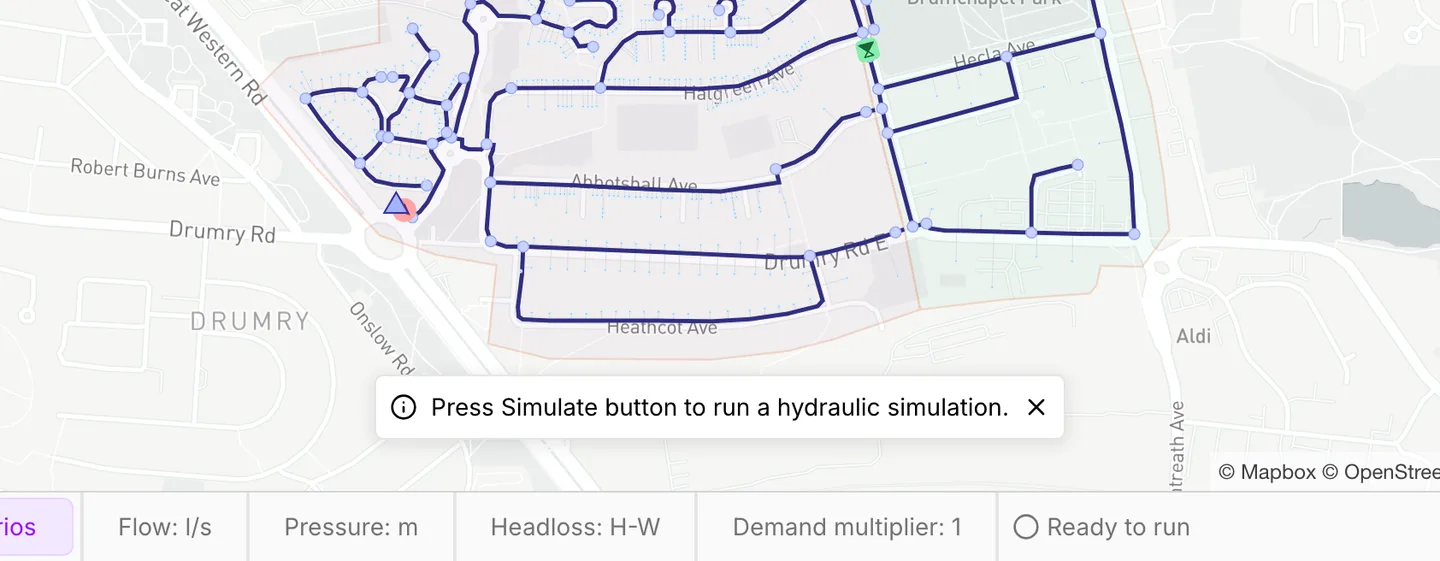
Section titled “The status bar”The status bar runs along the bottom of the window. It holds these parts, from left to right:
- The scenario switcher — see Scenario work.
- Flow, Pressure and Headloss, with the units and the headloss formula of the project.
- Demand multiplier.
- The status of the run.

The status is the quickest way to know where the model stands. It reads Ready to run before a run, and Running… during one. After a run it reads Simulation was successful, Simulation with warnings or Simulation with errors.
If you edit the model or the simulation settings after a run, the status changes to Simulation outdated. This status means that the results still drawn on the map no longer match the model.
On a narrower window, the left-hand group collapses into one button. This button opens the same values in a popover. The popover also holds Auto-lengths and Auto-elevations, which the bar does not show anywhere else.
The app shows a short hint over the bottom of the map about the work you are doing. A hint can tell you how to finish a pipe, that you can drag a node, or that you did not run the model yet. If you close a hint with its ×, it does not come back on that browser. Hints appear only on wide windows.
On a narrow window
Section titled “On a narrow window”The layout gives things up in stages as the window narrows. A small laptop or a tablet is then missing controls rather than showing them cramped. The stages are:
- The seven drawing tools collapse into one button, Drawing tools. Each click on this button goes to the next tool. You can press and hold the button, or right-click it, to choose one tool from a list. Select area and Selection trace work the same way at every width.
- Open source, the language selector, Welcome page and Help center move into a menu behind the ☰ button at the right of the menu bar. The toolbar drops Undo and Redo, but the shortcuts still work. The model builder also goes. The welcome dialog drops Import from GIS, and File > New project drops From GIS data.
- The side panel starts closed rather than open.
- On a narrower window still, every panel moves below the map. The Asset and Map tabs, Network Review, Collections, and each data table or HGL profile that you open become tabs of one panel. This panel starts open. The activity bar goes, and Toggle bottom panel takes the place of the three panel toggles. The app also drops the file name, Save and Allocate customer points. It drops the entries that start a blank project: Start project on the welcome dialog and Blank project in the File menu. It also drops the actions that change a shape: Redraw on a link, and Connect or Reconnect on a customer point.
- Selecting and finding assets — click, area select, trace, and the search box.
- Drawing and editing — the drawing tools and what happens when you move things.
- Keyboard shortcuts — the full list, and the in-app cheatsheet.